Abstract
Context:
Previous studies showed that the agreement among pathologists in recognition of mitoses in breast slides is fairly modest.
Aims:
Determining the significantly different quantitative features among easily identifiable mitoses, challenging mitoses, and miscounted nonmitoses within breast slides and identifying which color spaces capture the difference among groups better than others.
Materials and Methods:
The dataset contained 453 mitoses and 265 miscounted objects in breast slides. The mitoses were grouped into three categories based on the confidence degree of three pathologists who annotated them. The mitoses annotated as “probably a mitosis” by the majority of pathologists were considered as the challenging category. The miscounted objects were recognized as a mitosis or probably a mitosis by only one of the pathologists. The mitoses were segmented using k-means clustering, followed by morphological operations. Morphological, intensity-based, and textural features were extracted from the segmented area and also the image patch of 63 × 63 pixels in different channels of eight color spaces. Holistic features describing the mitoses' surrounding cells of each image were also extracted.
Statistical Analysis Used:
The Kruskal–Wallis H-test followed by the Tukey-Kramer test was used to identify significantly different features.
Results:
The results indicated that challenging mitoses were smaller and rounder compared to other mitoses. Among different features, the Gabor textural features differed more than others between challenging mitoses and the easily identifiable ones. Sizes of the non-mitoses were similar to easily identifiable mitoses, but nonmitoses were rounder. The intensity-based features from chromatin channels were the most discriminative features between the easily identifiable mitoses and the miscounted objects.
Conclusions:
Quantitative features can be used to describe the characteristics of challenging mitoses and miscounted nonmitotic objects.
Keywords: Breast cancer, breast histopathology, intensity-based features, mitotic figures, textural features
INTRODUCTION
Mitotic count is one the contributing factors in Bloom–Richardson–Elston grading system[1] and also has an independent prognostic value in breast cancer.[2] However, previous studies showed that the agreement among pathologists in counting mitoses is fairly modest.[1,3,4,5,6,7] For example, Meyer et al.[1] asked a group of five to seven pathologists to examine 10–23 patients' slides and found that the Cohen's kappa for pairwise agreement on mitotic grade ranged from 0.45 to 0.67 (moderate agreement) and the average Cohen's kappa for the object-level agreement was 0.38 (fair agreement). Malon et al.[5] performed larger object-level agreement on 4204 figures and found that the Cohen's kappa ranged from 0.13 to 0.44 (slight to fair agreement). Furthermore, a quality control program[8] performed among 13 Italian pathologists showed that the Cohen's kappa for agreement of pathologists to the reference value ranged from 0.11 to 0.86 (slight to good agreement).
Investigating causal agents for discrepancies in recognition of mitotic figures will be helpful in avoiding overcounting and undercounting of these figures. The wide range of appearances of mitotic figures and their similarity to other objects such as apoptoses within histopathology slides could be two potential reasons for misrecognition.
With the advent of whole-slide imaging, computer-based image analysis on the digital slides has become possible. Previously, different image processing features were used to automatically detect the mitoses on breast slides.[9] In this study, we aimed at determining image processing features differed significantly among easily identifiable mitoses, challenging mitoses, and miscounted nonmitoses. This study also seeks to compare different color spaces to determine which color spaces capture the difference among groups better than others.
MATERIALS AND METHODS
Data
The images were obtained from the Mitosis-Atypia grand challenge 2014 dataset,[10] which is publicly available and contained the location of mitotic figures. The slides were from six patients and were scanned using Aperio ScanScope XT slide scanner (Aperio Technologies, Vista, CA). Each image, with the size of 1376 × 1539 pixels, covered 0.1276 mm2 of tissue.
The dataset contained 453 mitoses and 265 nonmitoses. Two senior pathologists were asked to mark the center of mitoses and label them either as a “true mitosis” or “probably a mitosis.” In case of disagreement, the opinion of a third expert pathologist was requested. Based on the annotation provided by the readers, the marked objects were classified into four categories, those recognized by both pathologists (C1), those missed by one of the first two pathologists and recognized as a “true mitosis” by the third pathologist (C2), those labeled as “probably a mitosis” by majority of the readers (C3), and objects recognized as a mitosis by only one reader and labeled as nonmitosis by other two pathologist (C4). As stated in the dataset, the first three groups were considered as true mitoses while C4 was considered as false positive markings, i.e. miscounted nonmitoses. In the original dataset, the confidence level of being mitoses for these four categories was 1, 0.8, 0.6, and 0.2, respectively. Here, we considered C1 as the easily identifiable group while C3 was considered the most challenging category because the majority of the readers could not make a decision about it confidently.
Feature extraction
The center of each mitotic figure was provided in the dataset. Hence, an image patch of 63 × 63 pixels in the neighborhood of each annotation was used and the mitotic figures were segmented using k-means clustering.[11,12] Mitotic figures have different appearances in different stages of mitosis. For example, during telophase, where two daughter cells are being created, two separated connected components could be detected in the image patch, and in late metaphase, a hole could exist within the extracted component. In addition, in anaphase, segmentation might result in a large connected component and a few nearby smaller regions. To address these issues, morphological closing followed by filling holes was used. In addition, the convexity (area over convex area) of the largest connected component centered at the image patch was calculated. Only the largest connected component was considered as a mitotic figure unless the convexity was low and the area of the second largest connected component was comparable to that of the largest connected component. In this case, both connected components were included in the final segmentation.
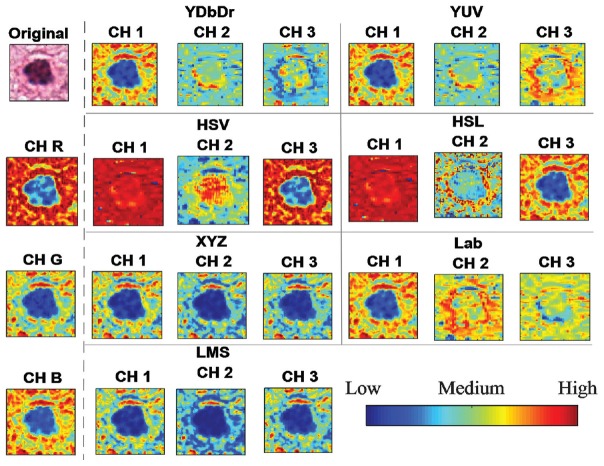
From each segmented mitotic figure, 13 shape-based features were extracted. The features are listed in Table 1. A brief intuitive description about the features along with a few sample images with high and low values of the particular feature is also shown in the table. When more than two components were segmented, major and minor axis length, and features of the second group [Table 1] were extracted from the larger component. In addition, the intensity-based features were also extracted from the largest segmented area. These features were extracted from each of the channels of red, blue, green (RGB) color space. Moreover, the image patches were converted to YDbDr, YUV, Lab, hue, saturation, and value (HSV), hue, saturation, and lightness (HSL), XYZ, and CAT02 long, medium, and short (LMS), and the features were also extracted from channels of these color spaces. A sample mitotic figure in different channels is shown in Figure 1. The intensity-based features were listed in Table 1 as well.
Table 1.
Extracted features from each object

Figure 1.
A mitotic figure in different color spaces
In addition, three groups of textural features, namely Haralick and Shanmugam texture,[13] neighborhood grey tone difference matrix,[14] and grey level run length matrix[15] were extracted from both image patches and the segmented areas. The features extracted from the segmented area describe the second and higher order statistics of the intensity value distribution within the area, while those extracted from the patch describe the local context of the objects. In addition, Gabor textural features[10] were extracted from the patches and the segmented areas' border. The textural features are also listed in Table 1. Finally, we extracted three measures for describing the contrast between the segmented area and its surrounding. The first and second contrast measures are the difference and the ratio of mean intensities of the mitotic figure and its surrounding respectively while the third measure is the difference in mean intensities normalized to the sum of the standard deviation of intensities of the mitotic figure and its surrounding.
In the original dataset, three pathologists also assessed six criteria related to the nuclear atypia in each image and gave a score from 1 to 3. These criteria were nuclei size, nucleoli size, anisonucleosis, chromatin density, and membrane thickness. Here, we used these criteria as global descriptors of each image. We hypothesized that in addition to the appearance of the mitotic figure and its local surrounding area, the contextual features from the image could also affect the detectability of mitotic figures. As there was variability among the pathologists' grades, the majority of the different scores was considered as a grade of each image.
Statistical analysis
To find features that differed significantly among different categories, the Kruskal–Wallis H-test was utilized and a P < 0.05 was considered as statistically significant. For those features differed significantly based on the result of Kruskal–Wallis H-test, pairwise comparisons were done using the rank-based Tukey-Kramer test to identify the pairs that differed significantly. Here six pairs, namely, C1 versus C2, C1 versus C3, C1 versus C4, C2 versus C3, C2 versus C4, and C4 versus C3 were possible. Moreover, we sought to determine whether there was a trend in any of the features from C4 to C1 and also examined features for trend from C1 to C3 (from the most challenging ones to easily identifiable). For this purpose, Spearman correlation was used. The statistical tests were performed using MATLAB 2016 b (Mathwork Inc., Natick, MA).
RESULTS
Significantly different features
As stated in section 2–4, 14 sets of local features were extracted from either the segmented area or the patch for each channel. From the shape-based features, all features except solidity (χ2 (3, 718) =7.7992, P = 0.0504) and eccentricity (χ2 (3, 718) =3.9022, P = 0.2722) were significantly different among the groups.
A post hoc test showed that the miscounted objects (C4) were different from the challenging mitotic figures (C3) in terms of circularity and mean distance to the nearest border point. None of the shape-based features resulted in a significant difference between C4 and C2, while the circularity of miscounted objects (mean rank = 382.41, standard deviation [SD] = 12.74) was significantly larger than that of easily identifiable mitotic figures (mean rank = 307.78, SD = 15.54). The mean distance to the border was also significantly different between C4 (mean rank = 389.03, SD = 12.74) and C1 (mean rank = 332.75, SD = 15.54). All size-related and shape factor features of challenging mitotic figures were significantly different from those of both C2 and C1. Among the size-related features, the magnitude of differences between the challenging mitotic figures and others were highest for the length of major axis. Shape factor was significantly different between C3 (mean rank = 314.02, SD = 15.55) and C1 (mean rank M = 378.13, SD = 15.54) as well as C3 (mean rank = 314.02, SD = 15.55) and C2 (mean rank = 406.87, SD = 21.05). Compactness was significantly different between C3 (mean rank = 321.98, SD = 15.54) and C2 (mean rank = 407.50, SD = 21.05) while circularity was significantly different between C3 (mean rank = 390.33, SD = 15.54) and C1 (mean rank = 307.78, SD = 15.54).
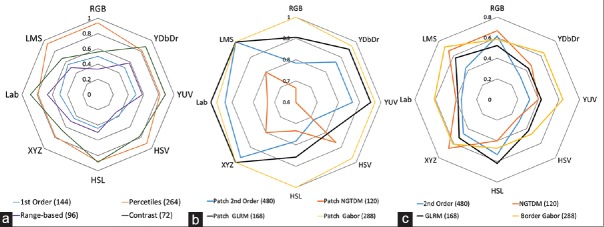
For different types of intensity-based features, the percentage of significantly different features is shown in Figure 2a in each color space. Overall, intensity-based features are more highlighted in Lab color space. Similarly, for eight sets of textural features, the percentage of significantly different features per each color space was shown in Figure 2b and c. As shown, overall the discriminative ability of the textural features from the image patch was the highest. Furthermore, XYZ and LMS captured the differences in the texture better than other color spaces.
Figure 2.
Percentage of features that differ significantly in each color space; total number of features in each set is shown in the parenthesis. (a) Intensity-based features; (b) textural features from patches; (c) textural features from the segmented area
Figure 3a-c shows the percentage of features that differed significantly per each feature set in the pairwise comparisons of C4 (miscounted non-mitoses) with C1, C2, and C3. As shown, textural features from patches generally captured the difference between different categories of mitotic figures and the miscounted objects better than other features. The features were ranked based on the obtained P value for each comparison. After considering the 50 features with the lowest P value, it was found that the percentile and contrast features from Db (YDbDr), U (YUV), and b (Lab) led to the lowest P values (that is, highest differences) for C1 versus C4 and also C2 versus C4. The Haralick and Gabor textural features extracted from the patches from all LMS and XYZ along with saturation channel led to the highest difference between C1 and C3.
Figure 3.

Percentage of each type of features that differed significantly in the pairwise comparisons of C4 (miscounted nonmitoses) with C3 (a), C2 (b), C1 (c)
Figure 4a and b presents the percentage of features that differed significantly per each feature set in the pairwise comparisons of C3 versus C1 and C3 versus C2, respectively. Ranking the features showed that the major axis length, perimeter, convex area, contrast, and Gabor features extracted from the patches led to the lowest P values for both C3 versus C1 and C3 versus C2 and the hue channel captured the differences better than others.
Figure 4.
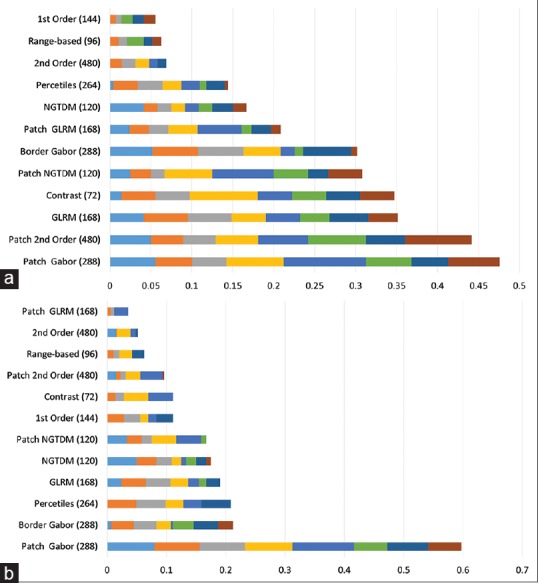
Percentage of features in each set that differed significantly in the pairwise comparisons of C3 with C1 (a) and C2 (b)
The analysis of the global features showed that all global scene descriptors except nuclei contour were significantly different among the groups. The post hoc test revealed the nuclei size of surrounding cells was significantly smaller for the miscounted objects (mean rank = 329.52, SD = 12.11) compared to C1 (mean rank = 408.69, SD = 20.02) and C2 (mean rank = 410.42, SD = 14.78). It was also shown that the nuclei size was significantly smaller in the challenging mitotic figures (mean rank = 326.41, SD = 14.78) in comparison with the easily identifiable ones (C1 and C2). On the other hand, the nucleoli size was significantly larger for C3 (mean rank = 410.66, SD = 13.94) compared to C1 (mean rank = 352.43, SD = 13.94). The value was lowest for C4 and the difference was significant for C4 versus C2 and C4 versus C3.
The mean anisonucleosis score of the mitoses' surrounding cells was lowest for the miscounted objects and differed significantly from all three categories of mitotic figures. The density of chromatin was significantly different for C4 (mean rank = 341.36, SD = 6.71) versus C3 (mean rank = 371.47, SD = 8.19). Finally, the membrane thickness was significantly different for C4 (mean rank = 336.02, SD = 7.69) versus C3 (mean rank = 382.43, SD = 9.39) and C1 (mean rank = 369.36, SD = 9.39). Again none of the global descriptors led to a significant difference for C1 versus C2.
Seventeen features were significantly different among all pairwise comparisons except C1 versus C2. All these features were percentile-based, from which fifteen were from Db (YDbDr), U (YUV), b (Lab) channels (five features per channel) and two from saturation channel of HSV and HSL.
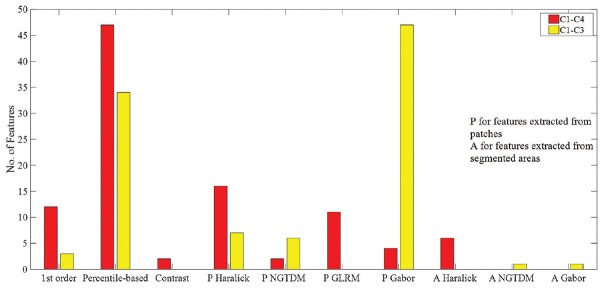
For 1241 features, the P value for Spearman correlation between features' value and the ordinal variable represent the groups (C1 to C4) was <0.05. The distribution of 100 features with the highest correlation across different feature types is shown in Figure 5. The corresponding Spearman correlation ranged from 0.21 to 0.32 with P < 0.0001. For 1059 features, there was a trend from the easily identifiable category (C1) to the challenging category (C3). Figure 5 also shows the distribution of 100 highest correlated features across different feature sets. The range of Spearman correlation for these features was 0.18–0.25 with P < 0.0001.
Figure 5.
Distribution of features ranked the highest in terms of showing a trend from C1 to C4 (red) and C1 to C3 (yellow)
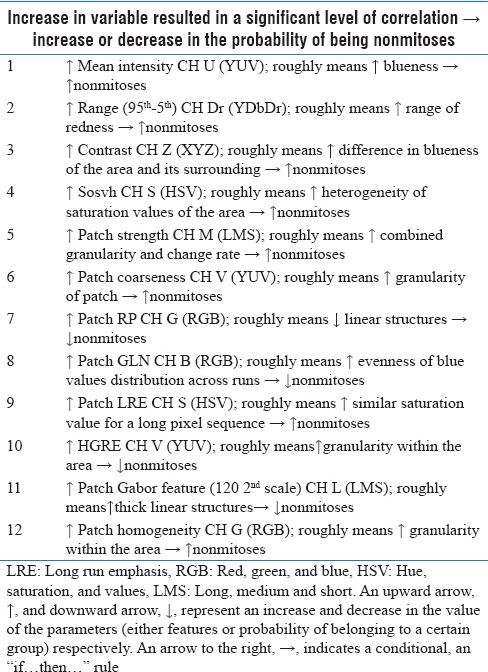
Table 2 shows a few examples of the features for which a trend was observed from C1 to C3. The examples are shown in a format of the if-then condition, for example, the first rule in the table could be interpreted as “recognition of mitotic figures with larger major axis length is less challenging.” Similarly, Table 3 shows examples of observed C1–C4, which represent the 100%–20% confidence level of being mitoses in the original dataset.
Table 2.
Examples of features for which a trend was observed within mitoses categories
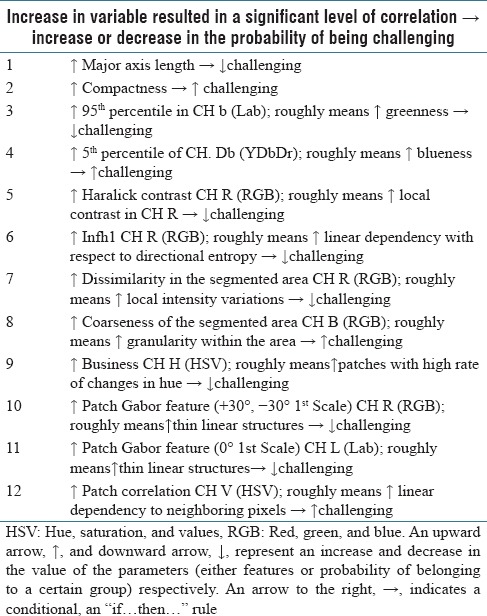
Table 3.
Examples of features for which a trend was observed from easily identifiable mitoses to nonmitoses
DISCUSSION
This study focused on a systematic analysis of different types of features and various color spaces to find quantitative features that differed significantly among easily identifiable mitotic figures, challenging ones, and the objects that were misrecognized as being mitotic figures by a pathologist.
Overall, the data demonstrated that quantitative features can capture the differences between appearances of the challenging mitotic figures (C3) and the easily identifiable ones (C1 and C2) and also miscounted objects (C4), and those of all three categories of mitotic figures (C1, C2, and C3). However, none of the features were significantly different between the mitotic figures missed by only one pathologist (C2) and those found by all pathologists (C1). The results further suggested that the missing the mitotic figures in category C2 could not be because of their appearance (image-based features). Furthermore, the mitotic figures were not equally distributed among the categories; C1 and C3 contained 178 mitoses and C2 contained 97 ones. The lower number of significantly different features in comparisons between C2 with other categories could be due to a lack of observations and thus lower statistical power.
It was also found that the distribution of significantly different features varies among color spaces. We can group the color spaces into four categories: RGB, which is an additive color space and often used for display technology, the Lab family, which separates luminance from chromatin and includes Lab, YUV, and YDbDr, the HSV family, which includes HSV and HSL and present color as HSVs, and color spaces such as XYZ and LMS, which are based on responsivity of three types of cones in the human eye. As shown in Figure 6, these two perceptually motivated color spaces capture the difference better than other color spaces. RBG followed in terms of capturing such differences. It should be noted that there is L, M, and S channels, named after cone cells responsive to LMS wavelength roughly correspond to RGB channels in RGB space. However, the better performance of LMS compared to RGB could be as result of being more robust to illumination conditions.
Figure 6.
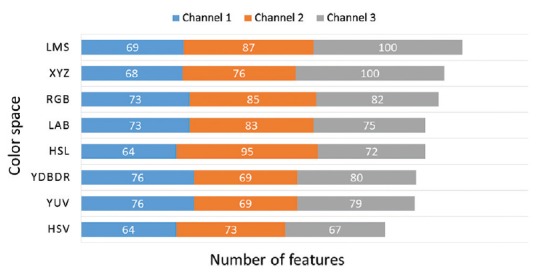
Distribution of significantly different features among various color spaces
As indicated in Figure 7, the discriminative ability of various color spaces was not the same for different comparison pairs. As expected, the different color spaces in the same family perform almost similarly. Among different mitoses categories, the miscounted objects' appearances and less easily identifiable mitoses resulted to the highest number of significantly different features. This could be because less easily identifiable mitoses deviate from the typical appearances of mitotic figures that pathologists have in their mind, while the miscounted objects share some similarity with this typical appearance and thus they are mistaken as being true mitoses because of this similarity. Across all color spaces, the numbers of significantly different features for the three comparisons that involved the miscounted objects were higher than those of comparisons among different categories of mitoses. Therefore, in spite of differences between the challenging mitoses and the easily identifiable ones, the magnitude of similarity between them still exceeds that of mitoses versus nonmitoses. In addition, features from HSL and HSV resulted into a higher number of significantly different features for C3 versus C1 and C3 versus C2, while LMS and XYZ captured the differences among the miscounted objects and mitoses better than other color spaces.
Figure 7.
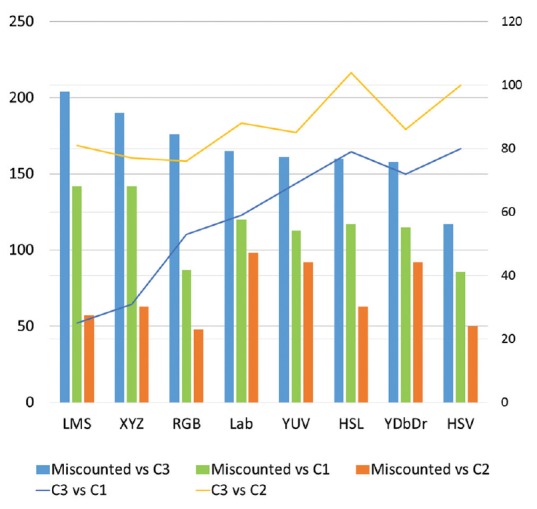
Number of significantly different features in various color spaces for pairwise comparisons
The analysis of the shape-based features indicated that the less easily identifiable mitotic figures are rounder and smaller (based on all of the size-related measures) than other mitotic figures, while the average miscounted object's size was similar to that of an average easily identifiable mitotic figure. However, the miscounted objects were rounder (based on circularity measure). The median of circularity of the different mitoses categories is lowest for C1 and highest for C3, and the circularity of C3 was approximately similar to that of the miscounted objects. In the early metaphase, the circularity measure is high, and it could be hypothesized that most of the miscounted objects were mistaken by cells in their early metaphase. It should be noted that performing morphological closing on the binary masks corresponding to the mitotic figures slightly affects the shape-based features. Morphological closing is defined as a dilation followed by erosion, using a structuring element. The size of the structuring element determines the smoothness of edge, the size of the filled gaps, and the size of the filled holes in the output of the operator. Here, we used a disk-shaped structuring element with a radius of two pixels. The morphological closing operator resulted in a slightly larger area (on average <1.4% increase in the size of the area when only one connected component existed); however, this operation was helpful because it included a few nearby smaller regions and thus it generated a better estimate for the mask of the mitoses. As a two-pixel disk-shaped structuring element was used here, smaller regions that are one or two pixels apart from the main connected component were included as a result of applying the morphological closing.
Also, in the k-means clustering algorithm, the final segmentation depends on the initial seeds. This could result in a noisy border in the final segmented region. The use of morphological opening could be beneficial in smoothing the edges and compensating the segmentation error. Among all features, the perimeter was affected the most (about 6%), however, the smoothed borders in the output of the morphological closing could lead to better estimates for the perimeter of mitotic figures. Among other size-related shape-based features, i.e. major axis length, minor axis length, convex area, and circumscribed circle diameter the observed changes were <1%. The effect of the operation on other shape-based features was negligible as they are proportional values. In addition, it should be mentioned that the size of the structuring element was small enough (two pixels) to make sure that the outer-borders of the segmented areas did not change dramatically. Moreover, changes due to the closing operation were significantly smaller than the differences between categories. For example, the changes in area due to the closing operation were about 7.5 pixels, which was significantly smaller than the differences between miscounted objects and mitotic figures (on average 90 pixels). Therefore, the closing operation did not affect the final comparisons.
As shown in Figures 3 and 4, some of the textural and intensity features differed significantly between different pairs. Ranking the obtained P value of significantly different features for comparison between the challenging mitoses (C3) and easily identifiable ones (C1) revealed that Gabor features from the patches are the most discriminative features, while a high proportion of intensity-based features showed no significant differences between the two groups. Therefore, challenging mitoses are mostly different from the easily identifiable ones in their texture and shape rather than the intensity levels. Gabor filter bank mimics the human visual system, which responds selectively to orientations and scales. Utilizing the energy content of a filtered image in a particular scale and orientation as a feature resembles the same procedure. This could be the reason why these features captured information about a mitotic figure being perceptually challenging for the readers. The significantly different intensity based features were either extracted from chromatin channels of Lab family or hue channel. Compared to other color spaces, Lab family is more perceptually uniform, which means that a change in the value of their channels produces a change of the same amount in perceived color. On the other hand, for comparing nonmitoses and easily identifiable mitoses, intensity-based features were the most discriminative ones.
All global scene descriptors except nuclei contour led into significant P values. When the context of mitotic figures contained smaller nuclei or larger nucleoli, recognizing mitotic figures was more difficult for pathologists. It could be hypothesized that these two factors made the scene more complex. Also, it was shown that the miscounted objects were often marked in images with smaller nuclei size, smaller nucleoli size, lower anisonucleosis score, and lower membrane thickness score.
The Kruskal–Wallis H-test is a nonparametric equivalent of ANOVA and dealt the groups as categorical variables. The group variable could be also treated as an ordinal variable, as the confidence level decrease from C1 to C3. We used the Spearman correlation to find whether there is a trend in change of the feature values from the less easily identifiable category to the challenging one. A similar analysis was also utilized to explore trends from C1 to C4, which represent the 100%–20% confidence level of being mitoses in the original dataset. Identifying these rules could be beneficial in improving the training provided to pathology residents and general pathologists. Paradiso et al. showed that extracting the methodological skills required to enhance performance from a quality control study[8] and reviewing these skills in a training course can increase the pathologists' performance in a short-term.[16]
Our study has a number of limitations. First, we used the opinion of pathologists while assessing hematoxylin and eosin (H and E) images as the ground truth. A definition of mitosis phase could be better accomplished with a combination of Ki-67 label and H and E image data. Particularly for C3, which was labeled as “probably a mitosis” by the majority of the readers, the Ki-67 label could help in establishing the ground truth. Moreover, the pathologists who annotated the images for this data set were expert readers (as stated in the data description). The quantitative features describing the appearances of challenging mitoses for pathology trainees or less experienced observers could be different from those features extracted here. Using the methodology described here for pathology residents could help us in quantifying the perceptual difficulty in recognition of mitotic figures for them and improve their education. In this study we used all cases and readers of a publicly available dataset (Mitosis-atypia challenge 2014), which included only data from senior pathologists, and hence we did not have access to data from less experienced readers. However, this study provides a methodology to systematically analyze the quantitative data and presents preliminary results from such methodology, and we hypothesize that a similar methodology could be used to analyze data from pathology residents and study their behavior. The data suggested that none of the features differed significantly between C1 and C2. Even in the simplest visual tasks, missing a few targets are inevitable. However, as other categories outnumbered C2, the lack of statistical power could be the reason of insignificant P values of the pairwise comparisons involved C2. One potential venue for further work is the expansion of this study to a larger dataset to quantify the differences between C1 and C2. In addition, intrapathologist variations could exist in recognizing mitotic figures. Therefore, another potential venue for future work could be investigating whether a reader would miss mitotic figures belonging to C2 (i.e., the ones which were missed one time) in the second reading.
Financial support and sponsorship
Nil.
Conflicts of interest
There are no conflicts of interest.
Footnotes
Available FREE in open access from: http://www.jpathinformatics.org/text.asp?2017/8/1/34/214164
REFERENCES
- 1.Meyer JS, Alvarez C, Milikowski C, Olson N, Russo I, Russo J, et al. Breast carcinoma malignancy grading by Bloom-Richardson system vs.proliferation index: Reproducibility of grade and advantages of proliferation index. Mod Pathol. 2005;18:1067–78. doi: 10.1038/modpathol.3800388. [DOI] [PubMed] [Google Scholar]
- 2.Medri L, Volpi A, Nanni O, Vecci AM, Mangia A, Schittulli F, et al. Prognostic relevance of mitotic activity in patients with node-negative breast cancer. Mod Pathol. 2003;16:1067–75. doi: 10.1097/01.MP.0000093625.20366.9D. [DOI] [PubMed] [Google Scholar]
- 3.Veta M, van Diest PJ, Jiwa M, Al-Janabi S, Pluim JP. Mitosis counting in breast cancer: Object-Level interobserver agreement and comparison to an automatic method. PLoS One. 2016;11:e0161286. doi: 10.1371/journal.pone.0161286. [DOI] [PMC free article] [PubMed] [Google Scholar]
- 4.Tsuda H, Akiyama F, Kurosumi M, Sakamoto G, Yamashiro K, Oyama T, et al. Evaluation of the interobserver agreement in the number of mitotic figures breast carcinoma as simulation of quality monitoring in the Japan National Surgical Adjuvant Study of Breast Cancer (NSAS-BC) Protocol. Cancer Sci. 2000;91:451–7. doi: 10.1111/j.1349-7006.2000.tb00966.x. [DOI] [PMC free article] [PubMed] [Google Scholar]
- 5.Malon C, Brachtel E, Cosatto E, Graf HP, Kurata A, Kuroda M, et al. Mitotic figure recognition: Agreement among pathologists and computerized detector. Anal Cell Pathol (Amst) 2012;35:97–100. doi: 10.3233/ACP-2011-0029. [DOI] [PMC free article] [PubMed] [Google Scholar]
- 6.Longacre TA, Ennis M, Quenneville LA, Bane AL, Bleiweiss IJ, Carter BA, et al. Interobserver agreement and reproducibility in classification of invasive breast carcinoma: An NCI breast cancer family registry study. Mod Pathol. 2006;19:195–207. doi: 10.1038/modpathol.3800496. [DOI] [PubMed] [Google Scholar]
- 7.Dalton LW, Page DL, Dupont WD. Histologic grading of breast carcinoma. Cancer. 1994;73:2765–70. doi: 10.1002/1097-0142(19940601)73:11<2765::aid-cncr2820731119>3.0.co;2-k. [DOI] [PubMed] [Google Scholar]
- 8.INfQAoTB Group. Quality control for histological grading in breast cancer: An Italian experience. Pathologica. 2005;97:1. [PubMed] [Google Scholar]
- 9.Gandomkar Z, Brennan PC, Mello-Thoms C. Computer-based image analysis in breast pathology. J Pathol Inform. 2016;7:43. doi: 10.4103/2153-3539.192814. [DOI] [PMC free article] [PubMed] [Google Scholar]
- 10.Roux L, Racoceanu D, Capron F, Calvo J, Attieh E, Le Naour G, et al. MITOS and ATYPIA. 2014. [Last accessed on 2017 May 10]. Available at: http://mitos-atypia-14.grandchallenge .
- 11.Ray S, Turi RH. Determination of number of clusters in k-means clustering and application in colour image segmentation. Proceedings of the 4th International Conference on Advances in Pattern Recognition and Digital Techniques. 1999:137–43. [Google Scholar]
- 12.Filipczuk P, Kowal M, Obuchowicz A. Engineering in Medicine and Biology Society. (EMBC) 35th. Annual International Conference of the IEEE 2013; 2013. Multi-label fast marching and seeded watershed segmentation methods for diagnosis of breast cancer cytology; pp. 7368–71. [DOI] [PubMed] [Google Scholar]
- 13.Haralick RM, Shanmugam K. Textural features for image classification. IEEE Trans Syst Man Cybern. 1973;3:610–21. [Google Scholar]
- 14.Amadasun M, King R. Textural features corresponding to textural properties. IEEE Trans Syst Man Cybern. 1989;19:1264–74. [Google Scholar]
- 15.Galloway MM. Texture analysis using gray level run lengths. Comput Graph Image Process. 1975;4:172–9. [Google Scholar]
- 16.Paradiso A, Ellis IO, Zito FA, Marubini E, Pizzamiglio S, Verderio P. Short- and long-term effects of a training session on pathologists' performance: The INQAT experience for histological grading in breast cancer. J Clin Pathol. 2009;62:279–81. doi: 10.1136/jcp.2008.061036. [DOI] [PubMed] [Google Scholar]


