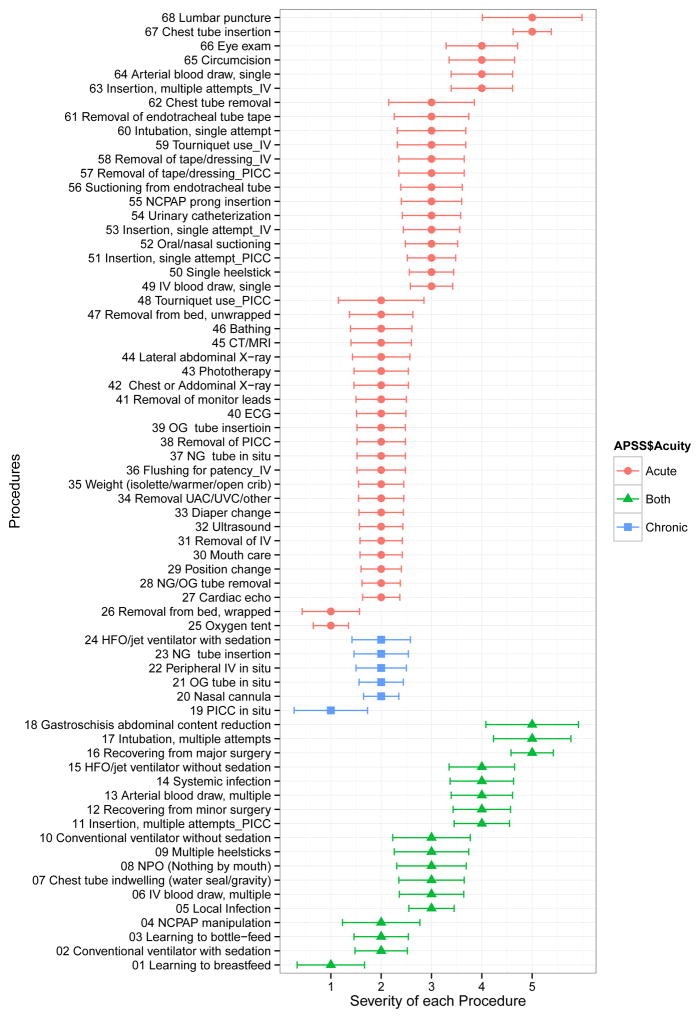
Figure 1. Severity and Acuity of each procedure.
Graph shows mode (dot) and average deviation of mode (error bar) of the severity of each painful/stressful procedure on a 5-point scale. The procedures were grouped into acute (red color), both acute and chronic (green color) and chronic (blue color) based on the mode of acuity.

