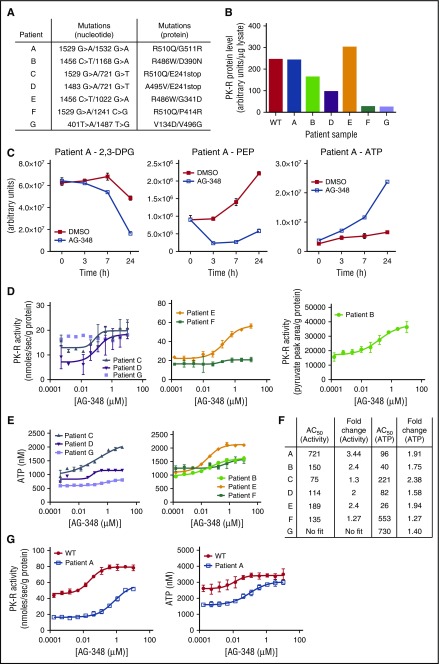
Figure 4.
AG-348 activation of mtPK-R in RBCs from patients with PK deficiency. (A) Genotypes of patients with PK deficiency described in these studies. (B) PK-R protein levels measured in patients with PK deficiency or WT controls. Data were not available from this assay for patient C, but a Western blot showing approximate protein levels in this patient is shown in supplemental Figure 6C. (C) Levels of 2,3-DPG, PEP, and ATP in RBCs from patient A at indicated times following treatment with DMSO or AG-348. (D) PK-R activity in PK-deficient RBCs incubated with AG-348 for 24 h (PEP = 0.5 mM). All PK-R activity measurements used the coupled enzyme spectrometric assay, except in the case of patient B, for whom activity was assessed by direct measurement of pyruvate formation using liquid chromatography followed by tandem mass spectrometry as described in the supplemental Methods. (E) ATP levels in PK-deficient RBCs incubated with AG-348 for 24 h. For panels D and E, please note that patient samples E and F were received via overnight courier post–blood draw, whereas other patient samples were received on the same day as blood draw, but potentially up to 8 h post–blood draw (supplemental Figure 5B-C). (F) Table showing AG-348 AC50 and fold-change observed in PK-R activity and ATP levels from indicated patient samples. AC50 values shown are in nanomolar. Fold-change (in relation to DMSO control) PK-R activity and ATP graphs are shown in supplemental Figure 6B. (G) PK-R activity (left) and ATP levels (right) in RBCs from patient A or a WT control (both prepared ∼30 min post–blood draw), incubated with AG-348 for 24 h. Panels D, E, and G show the average of 3 technical replicates. All error bars are standard deviations.

