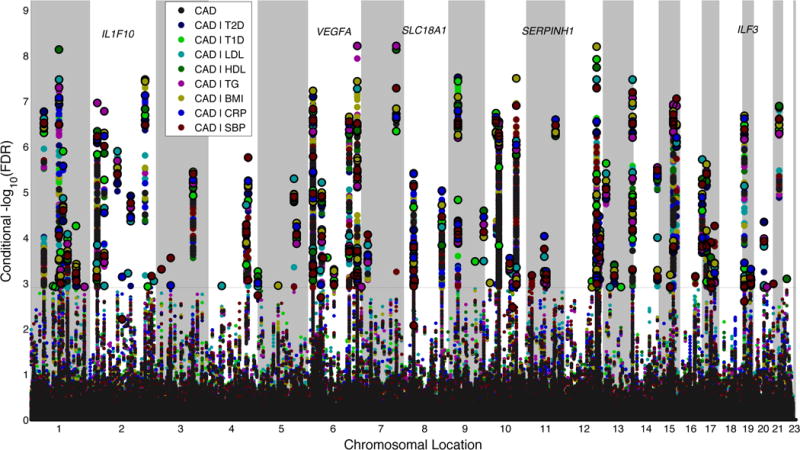
Figure 2.

‘Conditional FDR Manhattan plot’ of −log10 (FDR)* values for Coronary Artery Disease (CAD) alone (black), and −log10 (conditional FDR) for CAD given type 2 diabetes (T2D; CAD|T2D; navy blue), CAD given type 1 diabetes (T1D; CAD|T1D; light green), CAD given low density lipoprotein (LDL; CAD|LDL; aqua). CAD given high density lipoprotein (HDL; CAD|HDL; dark green), CAD given triglycerides (TG; CAD|TG; fuchsia), CAD given body mass index (BMI; CAD|BMI; mustard yellow). CAD given C-reactive protein (CRP; CAD|CRP; royal blue) and CAD given systolic blood pressure (SBP; CAD|SBP; maroon). SNPs with −log10 (conditional FDR) > 2.9 (i.e. overall FDR < 0.01 after Bonferroni correction for eight traits) are shown with large points. A black circle around the large points indicates the most significant SNP in each linkage disequilibrium block and this SNP was annotated with the closest gene which is listed above the symbols in each locus, except for the HLA region on chromosome 6, which was excluded from the analysis. Details for the novel loci with −log10 (conditional FDR) > 2.9 are given in Table 1.* For the –log10 (FDR) for CAD alone the maximum value displayed in this figure is 6.5. This is done purely for display purposes and as such should be interpreted as >6.5.
