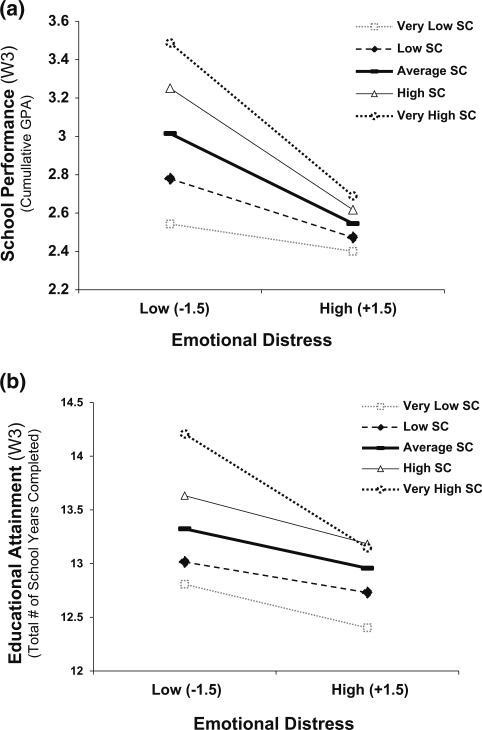
Fig. 4.
a Emotional distress (EMO) at Wave I (W1) predicting school performance at Wave III (W3) for 5 levels of perceived school connectedness (SC) at Wave I (W1). Notes school performance = cumulative GPA across 3 waves at Wave III (W3); scale range 0.0–4.0; possible EMO scores range from −1.5 to +1.5 (equivalent to 0–3 scale after centering): SC scores represent standard deviations from mean: −2SD (very low), −1SD (low), 0/mean (average), +1 SD (high), +2SD (very high). b. Emotional distress (EMO) at Wave I (W1) predicting educational attainment at Wave III (W3) for 5 levels of perceived school connectedness (SC) at Wave I (W1). Notes educational attainment = total number of school years completed at Wave III (W3); scale range: 6–22 years; scale range 0–4.0; possible EMO scores range from −1.5 to +1.5 (equivalent to 0–3 scale after centering); SC scores represent standard deviations from mean: −2SD (very low), −1SD (low), 0/mean (average), +1 SD (high), +2SD (very high)

