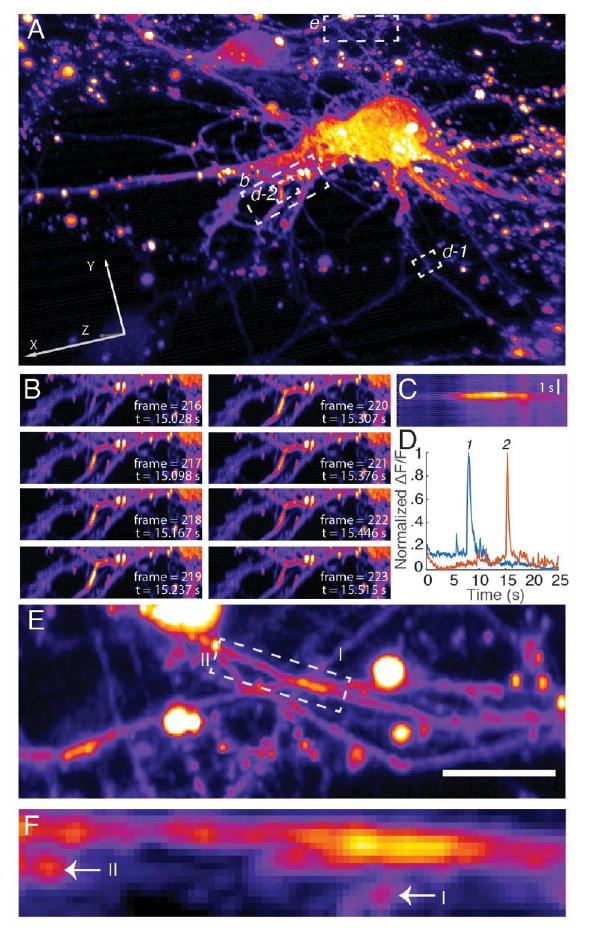
Fig. 4.

Calcium signaling in primary cortical neurons visualized with pLSFM. (A) 3D rendering of primary cortical neurons, labeled with GCaMP-6f. Action potentials were volumetrically imaged at 14.37 Hz for 500 time points. (B) Propagation of a calcium wave through a dendritic arbor. Sub-region from A. (C) Kymograph of action potential propagating along dendrite shown in B. (D) Temporal analysis of calcium bursts from regions specified in A. (E) Dense, overlapping region of axonal projections from region specified in A. Image shown as a maximum intensity projection parallel to the coverslip. (F). Cross-section normal to the coverslip of boxed region in E, shown as a maximum intensity projection over a depth of 3.2 μm. Arrows point at crossing dendrites that are also labeled in E. Scale bar 10 μm.
