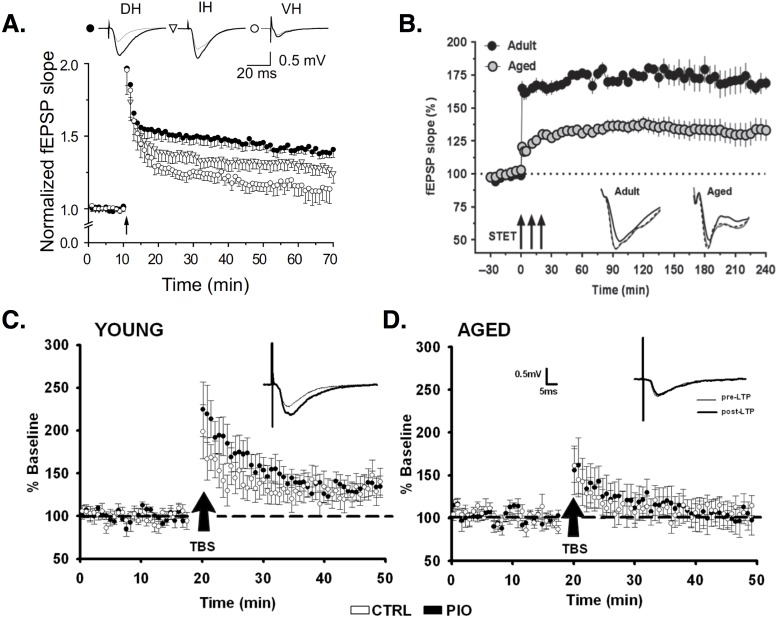
Figure 3. Synaptic plasticity in CA1 PCs.
(A) LTP induced by high-frequency stimulation (HFS) is larger in dorsal (filled circles) versus intermediate (open triangles) or ventral (open circles) horn PCs. Image is from Milior et al. (2016). (B) LTP induced by three trains of HFS (arrows; AKA strong tetanization protocol, STET) is reduced in aged (gray circles) versus young adult rats (black circles). Image is from Shetty, Sharma & Sajikumar (2017). (C–D) Baseline EPSPs are larger in young (C) versus aged (D) animals. Potentiation of synaptic responses is reduced or non-existent in aged animals (D). Images (C–D) are from Blalock et al. (2010). All figures reused under the CC-BY license.

