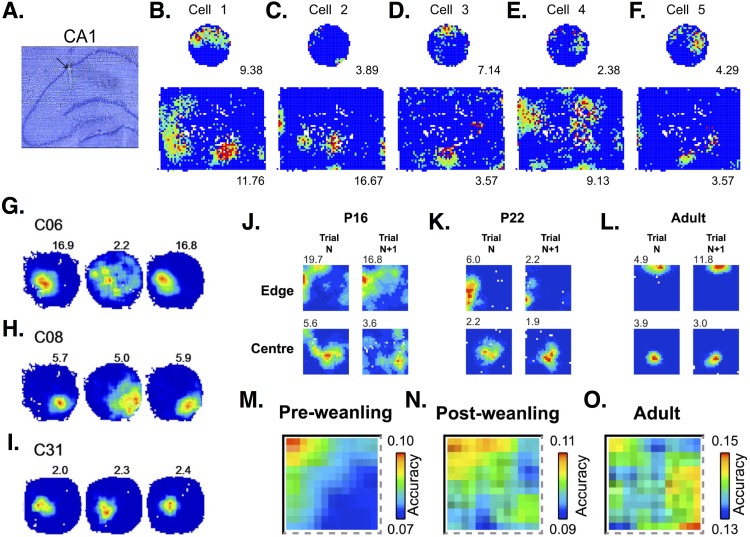
Figure 4. Place cell firing in CA1 PCs.
(A) Histological section showing the place cell recording site within CA1 region of the hippocampus. (B–F) Firing rate maps show that CA1 PCs in rats tend to develop single place fields in a small, circular environment but multiple place fields in a larger, square box enclosure. Maps from 5 different cells show some of the variability in spatial representations across PCs. Images (A–F) are from Park, Dvorak & Fenton (2011). (G–I) Firing rate maps in three different CA1 PCs show variable responses to light (left-hand circle), dark (middle circle), light (right-hand circle) conditions. Cell C31 (I) shows virtually no change in firing, while cells C06 (G) and C08 (H) show decreased frequencies and less-defined fields under dark conditions. Images (G–I) are from Zhang et al. (2014). (J–L) Firing rate maps at an initial time point (trial N) and 15 min later (trial N + 1) in postnatal day 16 (P16), P22, and adult rats. Developing rats have more diffuse and less stable place fields than adults. Images (J–L) are from Muessig et al. (2015). (M–O) Place cells in pre-weanling rats (P14-21) have good spatial accuracy at specific boundary points, but poor accuracy in the rest of the environment. In contrast, cells in more developed (post-weanling) or adult rats have good accuracy throughout the environment. Images (M–O) are also from Muessig et al. (2015). All figures reused under the CC-BY license.

