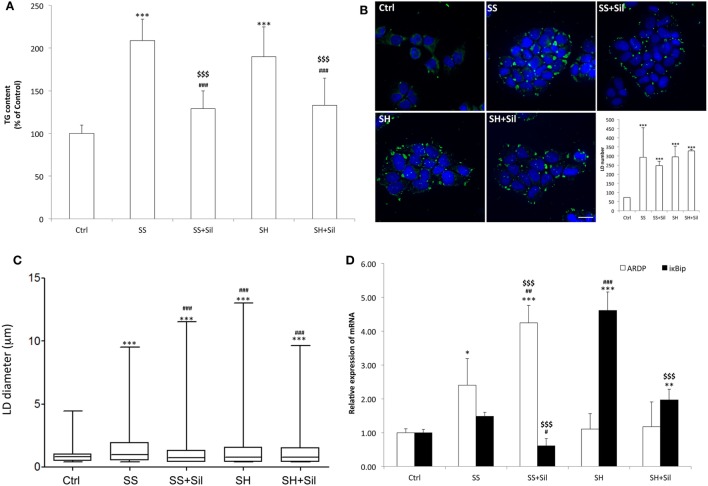
Figure 1.
Effect of silybin on lipid accumulation. Lipid accumulation parameters were measured in FaO cells incubated in the absence (Ctrl) or in the presence of fatty acids [simple steatosis (SS)] or fatty acids and tumor necrosis factor α (TNFα) [steatohepatitis (SH)] and subsequently treated with 50 µM silybin (SS + Sil or SH + Sil, respectively). (A) Intracellular triglyceride (TG) content quantified by spectrophotometric assay. Data are expressed as percent TG content relative to control and normalized for total proteins determined with bicinchoninic acid (BCA). Values are mean ± SD from at least three independent experiments. (B) Lipid droplets (LDs) visualized by fluorescence microscopy using BODIPY 493/503 (green fluorescence) and nuclei visualized by 4′,6-diamidino-2-phenylindole (DAPI) (blue fluorescence) (magnification 100×; scale bar: 10 µm). Representative images and the average LD number for all the experimental conditions were also shown. (C) Average LD size measured on two independent experiments (40 cells per treatment for each experiment) by using Huygens professional suite software. The results were plotted as box-and-whisker plot, showing the interquartile range, the median as horizontal bar and the whiskers are the minimum and maximum values. (D) The mRNA expression of adipose differentiation-related protein (ADRP) and IκB kinase β-interacting protein (IkBip) evaluated by quantitative PCR (qPCR); glyceraldehyde 3-phosphate dehydrogenase (GAPDH) was used as the internal control and data expressed as fold induction with respect to controls. ANOVA followed by Tukey’s test was used to assess the statistical significance between groups. Significant differences are denoted by symbols: Ctrl vs all treatments ***p ≤ 0.001, **p ≤ 0.01, *p ≤ 0.05; simple steatosis (SS) vs all treatments ###p ≤ 0.001, ##p ≤ 0.01, #p ≤ 0.05; steatohepatitis (SH) vs all treatments $$$p ≤ 0.001.

