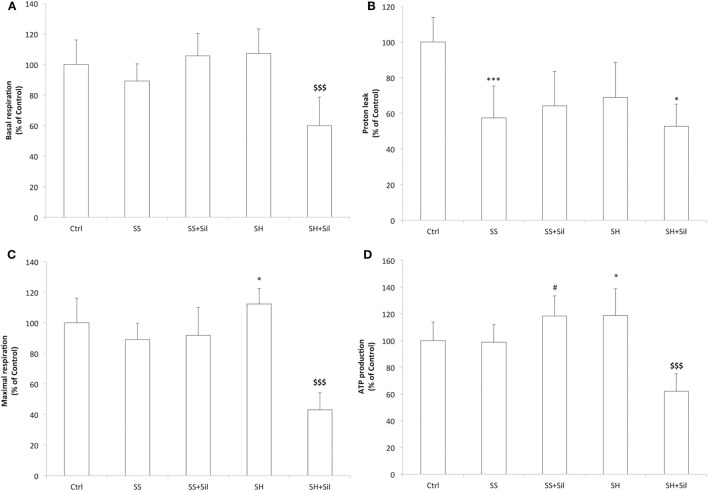
Figure 4.
Effect of silybin on mitochondrial oxygen consumption rates (OCRs). Under the conditions of Figure 1, we measured the cellular OCR by using Seahorse XFe96 Extracellular Flux Analyzer. The following respiratory parameters were evaluated: (A) Cell basal respiration (OCR pmol/min/SRB labeling). (B) Proton leak (OCR pmol/min/SRB labeling). (C) Cell maximal respiration (OCR pmol/min/SRB labeling); (D) ATP production (OCR pmol/min/SRB labeling). Data are expressed as mean ± SD of 14 separate experiments. ANOVA followed by Tukey’s test was used to assess the statistical significance between groups. Significant differences are denoted by symbols: Ctrl vs all treatments ***p ≤ 0.001, *p ≤ 0.05; SS vs all treatments, #p ≤ 0.05; SH vs all treatments $$$p ≤ 0.001.

