Figure 5.
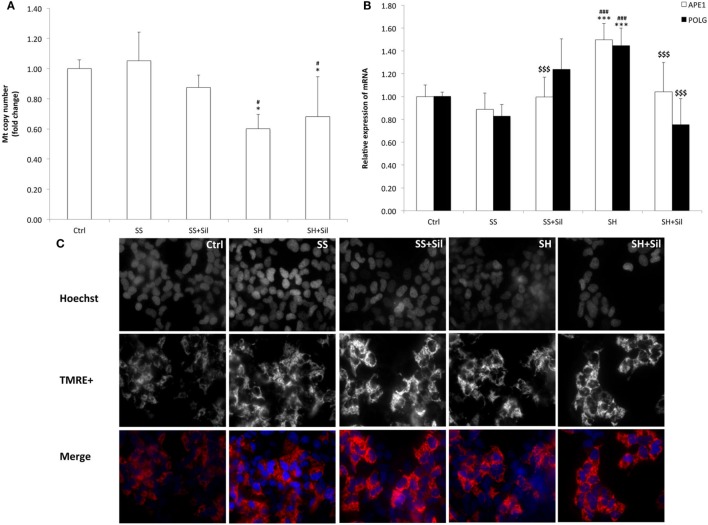
Effect of silybin on mitochondrial DNA (mtDNA) copy number and membrane polarization. Under the conditions of Figure 1, the following parameters were measured: (A) mtDNA copy number by quantitative PCR (qPCR) using primer for COII. The nuclear gene β-actin was used as the internal control; data were expressed as fold induction with respect to controls. (B) The mRNA expression of APE1 and POLG genes related to mtDNA repair; β-actin was used as the internal control and data were expressed as fold induction with respect to controls. (C) The mitochondrial polarization through cell vital staining with TMRE (mitochondria, red fluorescence) and Hoechst33342 (nuclei, blue fluorescence). Representative images for all the experimental conditions are reported separately for each staining (black/white) and then merged in colors. Images were acquired using 40× objective (scale bar 35 µm). Values are mean ± SD from at least three independent experiments. ANOVA followed by Tukey’s test was used to assess the statistical significance between groups. Significant differences are denoted by symbols: Ctrl vs all treatments ***p ≤ 0.001, *p ≤ 0.05; simple steatosis (SS) vs all treatments ###p ≤ 0.001, #p ≤ 0.05; steatohepatitis (SH) vs all treatments $$$p ≤ 0.001.

