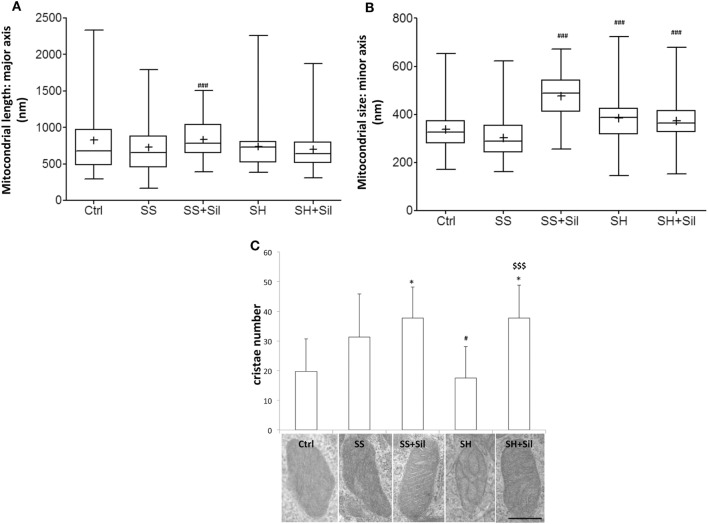
Figure 6.
Effect of silybin on mitochondrial shape. Under the conditions of Figure 1, cells were analyzed by electron microscopy and the following parameters were assessed: (A) mitochondrial length (major axis) and mitochondrial size (minor axis) (B) were measured. The results were plotted as box-and-whisker plot, showing the interquartile range, the median as horizontal bar and the whiskers are the minimum and maximum values. (C) Cristae number was also evaluated. Values are mean ± SD from all mitochondria scored in 20 images for each experimental condition. Representative electron micrographs of randomly selected mitochondria from each experimental condition are also shown. (magnification 25k; scale bar: 0.5 µm). Significant differences are denoted by symbols: Ctrl vs all treatments, *p ≤ 0.05; simple steatosis (SS) vs all treatments ###p ≤ 0.001 and #p ≤ 0.05; steatohepatitis (SH) vs all treatments $$$p ≤ 0.001.

