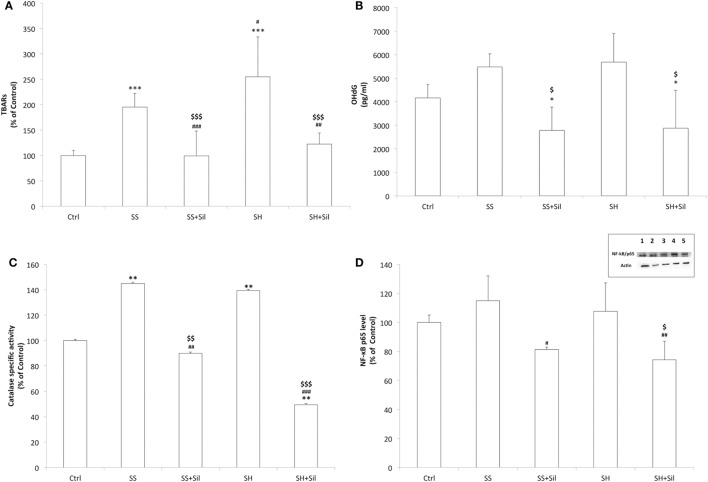
Figure 7.
Effect of silybin on oxidative stress end-points. Oxidative stress end-points were determined in FaO cells treated under the conditions described in Figure 1: (A) the intracellular level of MDA (pmol MDA/mL/mg of proteins) by spectrophotometric thiobarbituric acid reactive substances (TBARS) assay. Data are expressed as percentage values with respect to controls and normalized for total proteins. (B) Levels of 8-hydroxy-2-deoxy guanosine (8-OHdG) (pg/mL) released into the culture medium measured by competitive ELISA. (C) Catalase enzymatic activity (μmoles of decomposed H2O2/min/mg of proteins) by spectrophotometric assay. Data are expressed as percentage values with respect to controls and normalized for total proteins. (D) Densitometric analysis of nuclear nuclear factor kappa-B (NF-κB)/p65 evaluated by Western blotting. Data are expressed as percentage values with respect to controls and normalized for β-actin. Immune complexes were visualized using an enhanced chemiluminescence, quantified using a computerized imaging system (Biorad Quantity One 1-D Analysis Software) and expressed as relative optical density (ROD, arbitrary units). Inset: representative image of NF-κB/p65 immunoreactive bands: control (lane 1), simple steatosis (SS) (lane 2), SS + Sil (lane 3), steatohepatitis (SH) (lane 4), and SH + Sil (lane 5).Values are mean ± SD from at least three independent experiments. ANOVA followed by Tukey’s test was used to assess the statistical significance between groups. Significant differences are denoted by symbols: Ctrl vs all treatments ***p ≤ 0.001, **p ≤ 0.01, *p ≤ 0.05; SS vs all treatments ###p ≤ 0.001, ##p ≤ 0.01, #p ≤ 0.05; SH vs all treatments $$$p ≤ 0.001, $$p ≤ 0.01, $p ≤ 0.05.

