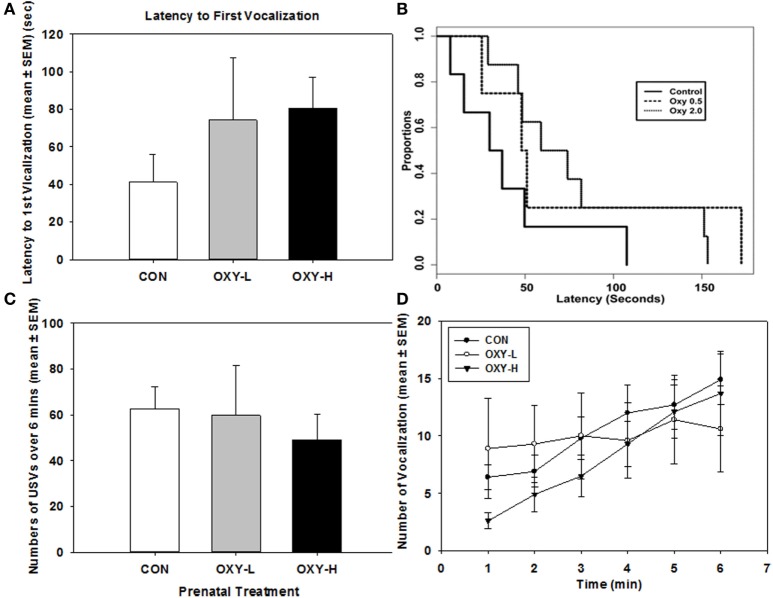
Figure 2.
(A) Latency to the first vocalization of rat pups; (B) Kaplan–Meier plot of latency to the first ultrasonic vocalizations (USVs) in rat pups in control (CON, solid line), oxycodone low dose (OXY-L, long dashed line), and oxycodone high dose (OXY-H, dotted line) groups; (C) total number of vocalizations of rat pups during USV test in CON (white bar; n = 6), OXY-L (gray bar; n = 4), and OXY-H (black bar; n = 8) groups; and (D) number of USVs per minute across the testing period in CON (closed circles), OXY-L (open circles), and OXY-H (closed triangles) groups.

