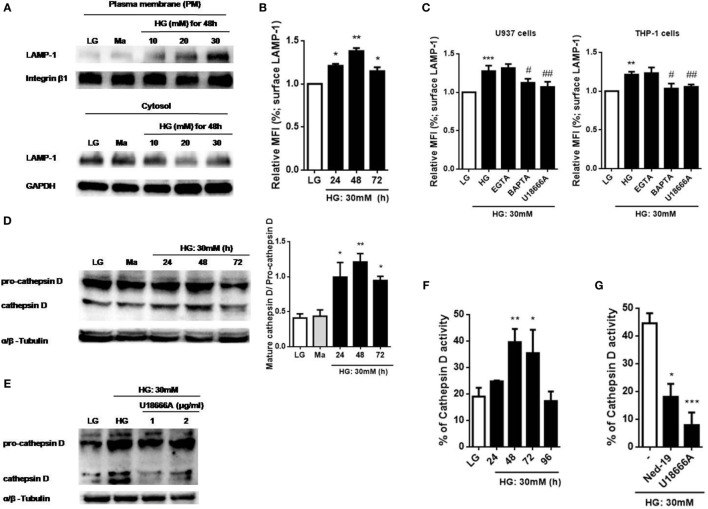
Figure 4.
High glucose (HG) increased intracellular Ca2+-dependent surface lysosomal-associated membrane protein-1 (LAMP-1) level and cathepsin D maturation and activity in U937 and THP-1 cells. (A) Representative immunoblots for LAMP-1 and integrin β1 levels on the plasma membrane (PM), and LAMP-1 and GAPDH levels in the cytoplasm under low glucose (LG; 5.5 mM glucose), mannitol (Ma; 30 mM mannitol) and HG (10, 20, 30 mM glucose for 48 h) in U937 cells. (B,C) The relative median fluorescence intensity (MFI) of surface LAMP-1 staining, (B) under LG and HG (30 mM glucose for 24–72 h) in U937 cells, or (C) in the presence of ethylene glycol tetra acetic acid (EGTA) (5 mM), BAPTA (10 µM), or with the pre-treatment of U18666A (2 µg/ml) under HG (30 mM glucose for 48 h) in U937 and THP-1 cells (n = 4). (D,E) Representative immunoblots and graphs for pro- and mature cathepsin D, and α/β-Tubulin under LG or HG (30 mM glucose for 24–72 h), or (E) with the pre-treatment of U18666A (1, 2 µg/ml) under HG (30 mM glucose for 48 h) in U937 cells. (F,G) Cathepsin D activity was measured by cathepsin D activity kit. U937 cells were (F) stimulated with HG (30 mM glucose for 24–96 h), or (F) with the pre-treatment of U18666A (2 µg/ml) or trans-Ned-19 (Ned-19; 100 µM) under HG. The percentage of cathepsin D activity was normalized to (F) LG or (G) HG (n = 3). Data were shown as mean ± SEM. (B–F) *P < 0.05, **P < 0.01, and ***P < 0.001 vs. LG; #P < 0.05 and ##P < 0.01 vs. HG. (G) *P < 0.05 and ***P < 0.001 vs. HG.

