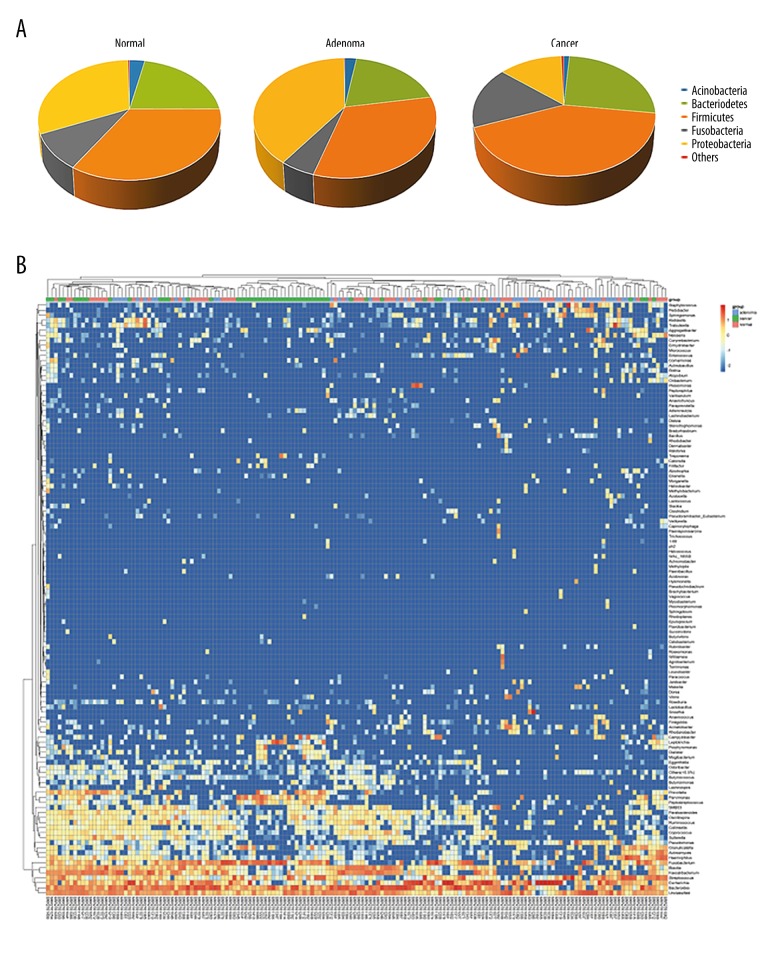
Figure 3.
Taxa analysis at the phylum and genus levels. (A) Proportions of main bacterial phyla in the 3 groups. (B) Relative abundances of some major genera across all samples. Each row represents 1 genus and each column represents 1 sample. The first row shows the groups of every sample (red). The clustering tree of samples was generated using euclidean distance with complete method. The color intensity of each genus is proportional to its relative abundance in each sample.

