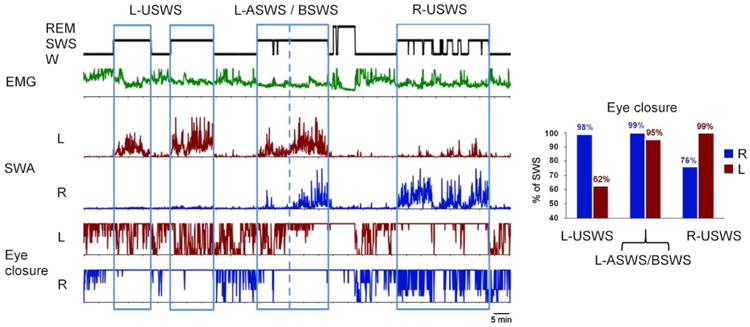
Figure 3.

Association between sleep and eye states in a fur seal. The diagrams on the left side (from top to bottom) show behavioral states (W- wakefulness, SWS – slow wave sleep and REM – rapid eye movement sleep), integrated neck electromyogram (EMG), slow wave activity (SWA, EEG power in the range of 1.2–4 Hz) in the left (L) and right (R) cerebral hemispheres and the time of closure of the left (L) and right (R) eyes. All parameters were scored or calculated for consecutive 5-sec epochs. Time scale is 5 min. Blue boxes highlight episodes of unihemispheric and asymmetrical SWS (USWS and ASWS) in the left and right hemispheres (L-USWS and R-USWS), and an episode of L-ASWS transitioned into bilateral SWS (BSWS). The blue dotted line separates the margin between L-ASWS and BSWS. The diagram on the right side shows percentage of time each eye was closed during the two episodes of L-USWS combined, episode of L-ASWS / BSWS and the episode of R-USWS as marked on the left diagram.
