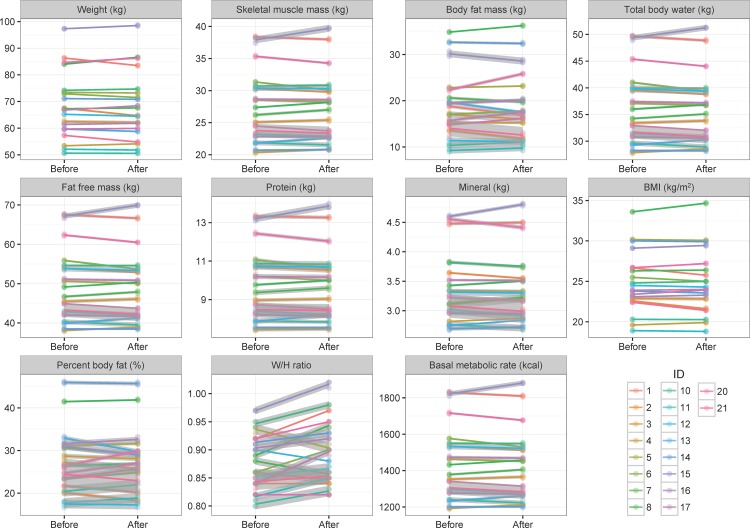
Fig 2. Differences of the results of bioelectrical impedance analysis between before and after 60 days of probiotic administration.
A total of 11 indexes were measured by the bioelectrical impedance analyzer. The color of each line represents experimental subjects, and the slope represents the difference between before- and after- trials. The gray shades represent standard errors, which were estimated by three times technical replications. In most cases, measured values are not changed after probiotic administration, but the difference of the W/H ratio was significantly observed in bioelectrical impedance analysis.

