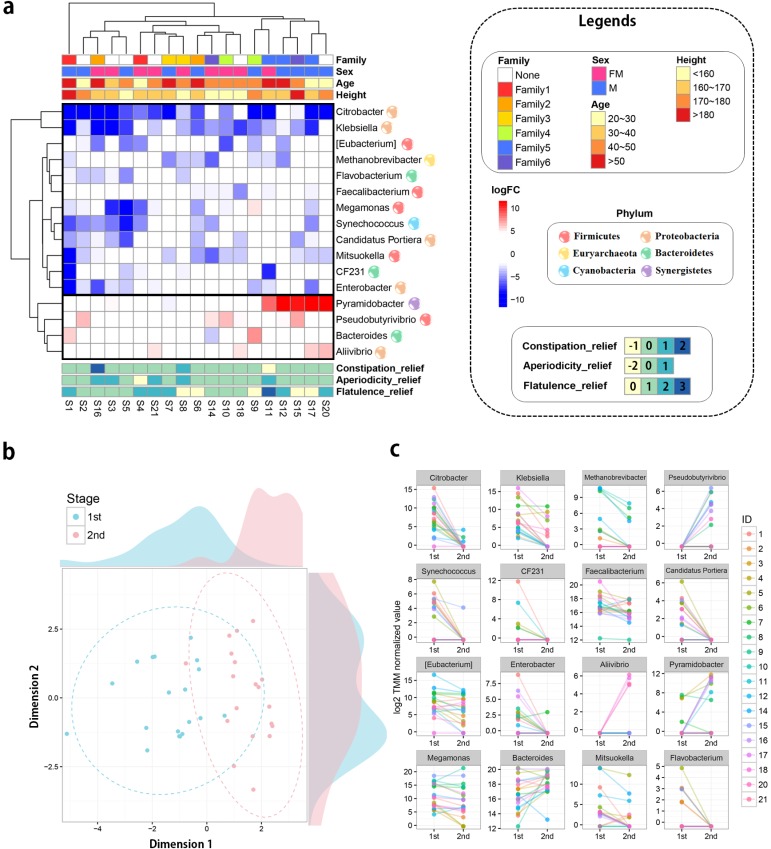
Fig 4. Combined results of the metagenome analysis.
(a) Significantly detected genera in the statistical comparison between before and after trials. The ordering for sample and microbiome were determined based on the result of the hierarchical clustering (from far to near ordering). For the clustering analysis, Euclidean distance method was used as distance metric and complete method was employed as breakpoint distance. Total 16 genera were observed at FDR-adjusted P-value < 0.05 and their log2 fold changes were visualized as heat map. The red and blue colors represent up- and down- regulated genera and color intensities show the difference of abundances between before- and after trials. The heat map was annotated by four covariate information and degree of reliefs for three gastrointestinal symptoms. (b) Multidimensional scaling plot (MDS plot) displays gut microbiomes’ change via probiotic intervention. Blue and red colors represent before and after trials, respectively. The dotted circles represent estimated confidence ellipse in multivariate analysis. (c) Line plots of significantly detected 16 genera with their measured abundances. Each line and color display an individual change in OTUs’ abundance. The OTUs’ abundance represents log2 TMM normalized values.

