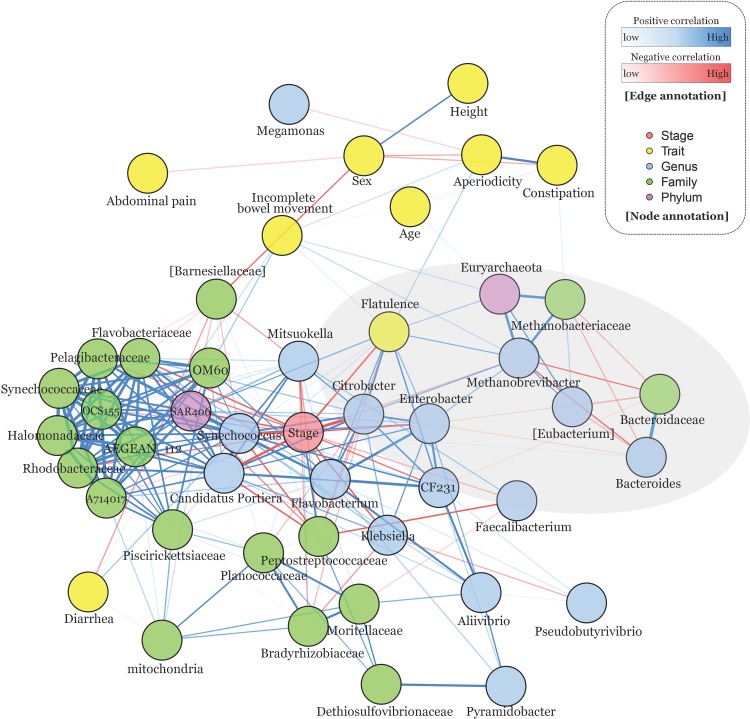
Fig 5. The result of correlation-based network analysis.
Significantly detected OTUs (FDR adjusted P-value < 0.05) in the genus, family, and phylum taxonomic levels. The network plot is drawn with phenotypes and six gastrointestinal symptoms. Spearman’s correlation test was employed, and only the significantly detected relationships (FDR adjusted P-value < 0.05) were visualized in the network plot. The edges show the strength of the correlation relationships and their colors represent positive and negative correlation as blue and red colors, respectively. The gray ellipse represents significantly observed traits after 60 days of probiotic intervention and their correlated OTUs (S11 Fig).

