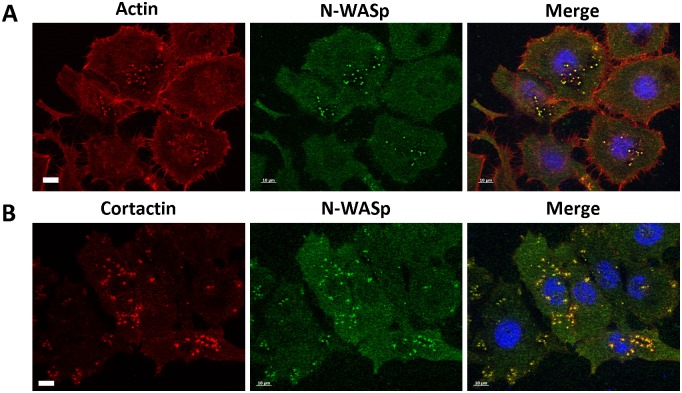
Fig 4. N-WASp colocalizes with invadopodia markers.
Representative epifluorescence images of HNSCC61 head and neck squamous cancer cells. Nuclei were visualized with DAPI (blue) and N-WASp (green) with anti-N-WASp antibody. Invadopodia were visualized by using an invadopodium marker; (A) actin (red) with Alexa Fluor labelled phalloidin and (B) cortactin (red) with anti-cortactin antibody. (Scale bar = 10 μm).

