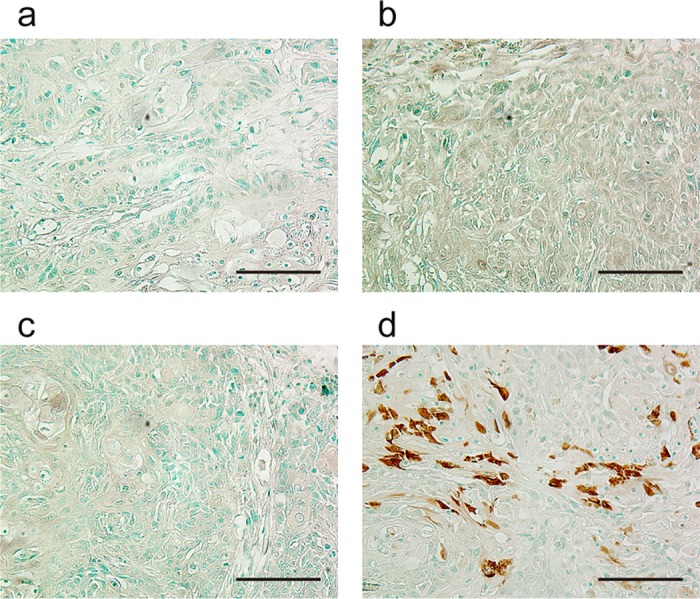
Fig 5. TUNEL analysis of xenografts after in vivo sonoporation with BLM.

Ca9-22 xenograft–bearing mice were exposed to sonoporation in vivo. (a) control, (b) BLM injection, (c) sonoporation with MBs and BLM injection, (d) sonoporation with EGFR-MBs and BLM injection. TUNEL signal was visualized by diaminobezidine (DAB, brown) and cell nuclei were counterstained by methyl green. Magnification, 400×; bar, 100 μm.
