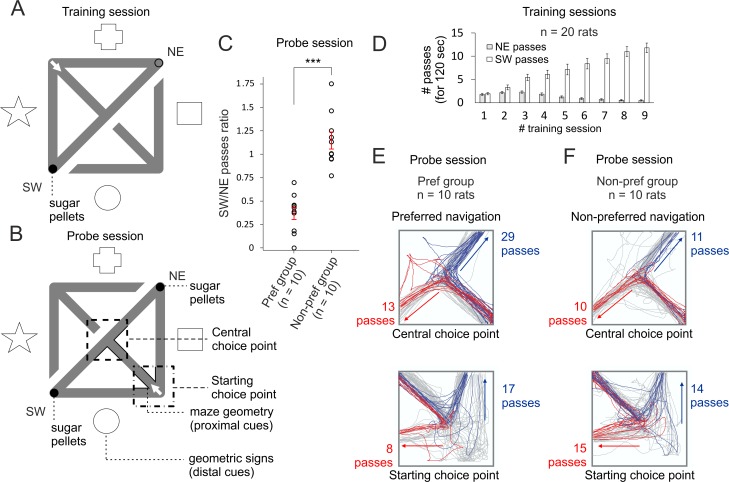
Fig 1. Differential navigation in continuous T-maze.
(A) Behavioral setup of the training sessions for the continuous T-maze. The animals were placed on the starting choice point (marked with a white arrow) and allowed to freely navigate for 12 minutes. Two pellets were continuously positioned at the end of the southwest (SW) corner (reward zone, marked with filled black circle), while no pellets were positioned in the northeast (NE) corner. The acquisition of the task was based on the spatial guiding of both maze geometry (proximal cues) and geometric paper signs on the curtains surrounding the arena (distal cues). The identification of the distal cues was designed in a manner in which approximately half of the animals would rely on them for spatial navigation. During the training sessions, the animals were placed on the starting choice point (marked with a white arrow) and allowed to explore the maze. Direct passes between the SW and NE zones were not rewarded with pellets. The opposite section of the maze was visible for the rats but not accessible. The animals (n = 20 rats) underwent 9 training sessions over 3 days. (B) During the probe session (on day 4), the animals were exposed to a reversed configuration of the maze, in which access to the training T-maze was disconnected. The animals were placed on the starting choice point of the opposite T-maze (marked with a white arrow), while access to the training T-maze was disconnected. In this way, the rats were exposed to the same proximal but opposite distal cues. Two pellets were constantly positioned in both SW and NE corners. We evaluated the direction of the passes from the starting choice point (marked with a white arrow) and the central choice point. (C) Comparison of the ratio of SW to NE passes. Error bars, mean ± SEM, n = 10 rats (preference group), n = 10 rats (nonpreference group), 2-tailed independent t test, t(18) = 6.955, ***p < 0.001. Both groups (the preference and nonpreference groups) had the same training. The chance level of preferential versus nonpreferential navigation was based on the number of passes from the choice points towards each of the corners given the total number of passes; binomial probability values of p < 0.05 indicated preferential navigation. (D) Learning curve of the animals’ navigation during the training sessions. All animals underwent 9 training sessions over 3 days. White bars show the number of passes towards the rewarded SW corner for the first 120 seconds of each recording session, while the grey bars show the number of passes towards the NE corner (with no reward) for the first 120 seconds. Two-way ANOVA, between groups, F(1,19) = 59.812, p < 0.001, n = 20. (E) Representation of the passes from the preference group rat towards the SW corner (in red) and towards NE corner (in blue) from the central choice point (above) and from the starting choice point (below). (F) Representation of the passes from the nonpreference group rat towards the SW corner (in red) and towards NE corner (in blue) from the central choice point (above) and from the starting choice point (below). The grey lines indicate passes from the corners towards the choice points or direct passes between the reward points. Files dataset is available at Figshare public repository in Tsanov 2016 data / Continuous T-maze folder https://figshare.com/s/b86a9a111353ba04bd32 and Tsanov 2017 data / Continuous T-maze CA1 folder https://figshare.com/s/5c5ba9b2811f3d7b7696.

