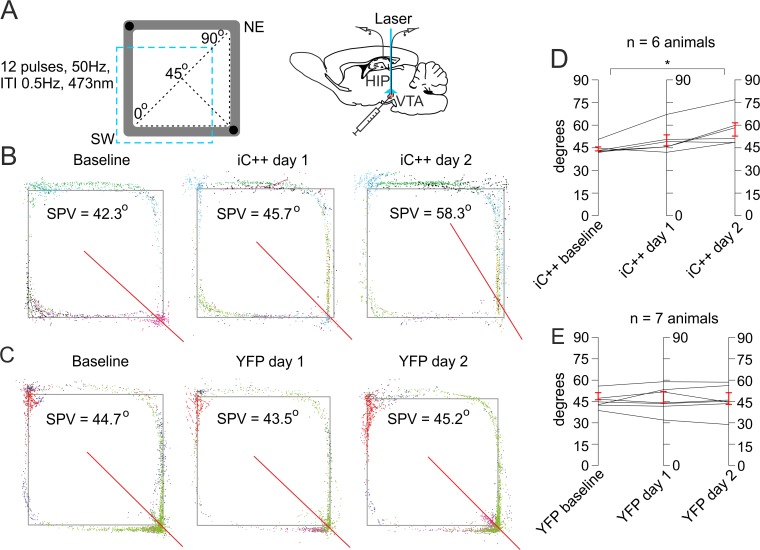
Fig 5. Suppression of tegmental dopaminergic activity induces bias in the place field assembly distribution.
(A) Behavioral setup of laser application (marked with a blue dashed square) in the south and west arms of rectangular-shaped linear track. Black circles indicate pellets delivery. The spatial population vector (SPV) values are measured between the southwest (SW) corner, where the SPV is 0°, and the northeast (NE) corner, where SPV is 90°. The diagonal between the SW and NE corners indicates SPV of 45°. Atlas schematic on the right shows the location of the optic fiber in the ventral tegmental area (VTA) and recording tetrodes in the hippocampal CA1 region. (B) Sample spatial distribution of the spikes (colored dots) from the place cells (represented by different colors) recorded during the baseline session (left), first (middle) and second (right) light delivery session from a light-activated chloride channel (iC++) group animal and (C) from a control yellow fluorescent protein (YFP) group animal. The straight red line denotes the weighted SPV in degrees between SW at 0° and NE at 90°. (D) Comparison of the weighted SPV in degrees between the baseline (left), first session (middle) and second session (right) photoinhibition for the iC++ group of rats, n = 6 rats, paired t test, day 1: t(5) = −2.169, p = 0.082; day 2: t(5) = −3.784, *p = 0.013; and (E) control light application for the YFP group of rats, n = 7, paired t test, day 1: t(6) = 0.136, p = 0.896; day 2: t(6) = 0.564, p = 0.593. Error bars, mean ± SEM. Files dataset is available at Figshare public repository in Tsanov 2016 data / Rectangular track folder https://figshare.com/s/b86a9a111353ba04bd32.

