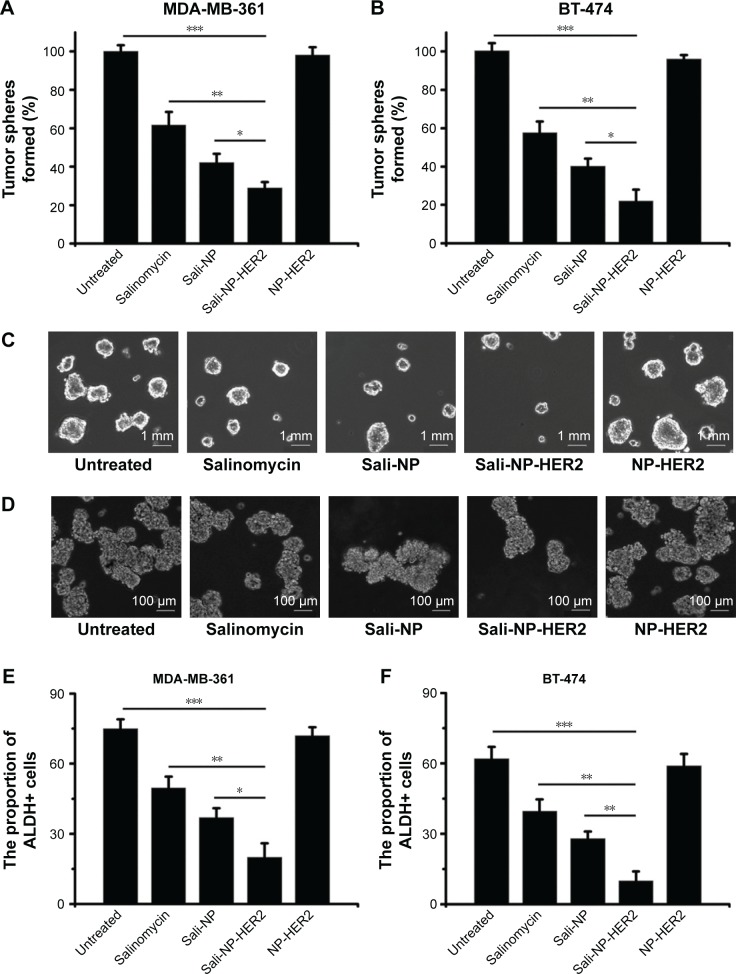
Figure 5.
Effect of treatments on the percentage of CSCs.
Notes: Effect of the treatments on the proportion of CSCs in breast cancer cells, as reflected by the tumorsphere formation rate (A and B) and the proportion of ALDH+ cells (E and F). Representative images of tumorspheres formed by (C) MDA-MB-361 cells and (D) BT-474 cells are shown. The rate of tumorsphere formation is defined as the number of tumorspheres formed in 7 days in the treatment group divided by the number of tumorspheres formed in 7 days in the untreated group; the rate of tumorsphere formation in the untreated group is used as a control and defined as 100%. The two groups were compared by one-way ANOVA with the Newman–Keuls method. Data are expressed as mean ± SD (n=6). *P<0.05; **P<0.01; ***P<0.001.
Abbreviations: ANOVA, analysis of variance; ALDH, aldehyde dehydrogenase; CSCs, cancer stem cells; Sali-NP, salinomycin-loaded polymer–lipid nanoparticles; NP-HER2, polymer–lipid anti-HER2 nanoparticles; Sali-NP-HER2, salinomycin-loaded polymer–lipid hybrid anti-HER2 nanoparticles.

