Figure 6.
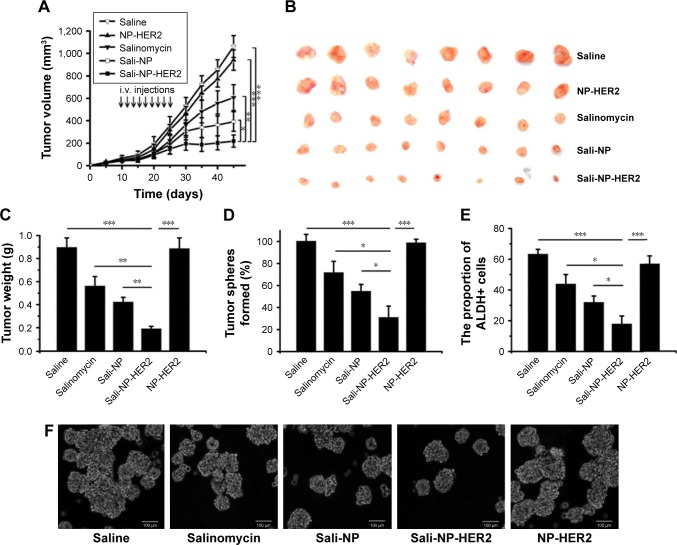
In vivo antitumor assay in mice bearing subcutaneous BT-474 tumors.
Notes: BT-474 tumors reached ~50 mm3 in size by day 10. From day 10, mice were injected with nanoparticles (7.5 mg salinomycin/kg, i.v.) through the tail vein, and salinomycin (7.5 mg salinomycin/kg) dissolved in ethanol was administered by intraperitoneal injection. Therapy was given nine times on alternate days (indicated by arrows), and tumor volume was calculated. (A) Tumor growth curve. (B) Excised tumors. (C) The excised tumors were weighed at the end point. On day 28, the effect of the drug treatments on the CSC proportion in BT-474 tumors in vivo was evaluated by (D) the rate of tumorsphere formation and (E) the proportion of ALDH+ cells from the excised tumors. (F) Representative images of tumorspheres from (D) are shown. The two groups were compared by one-way ANOVA with the Newman–Keuls method. Data are expressed as mean ± SD (n=8). *P<0.05; **P<0.01; ***P<0.001.
Abbreviations: ANOVA, analysis of variance; ALDH, aldehyde dehydrogenase; CSC, cancer stem cell; i.v., intravenous; Sali-NP, salinomycin-loaded polymer–lipid nanoparticles; NP-HER2, polymer–lipid anti-HER2 nanoparticles; Sali-NP-HER2, salinomycin-loaded polymer–lipid hybrid anti-HER2 nanoparticles.

