
Fig. 2. Design and characterization of plasmonic cavities containing quantum dots.
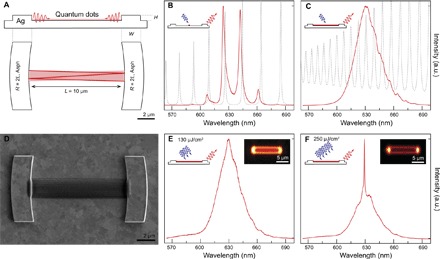
(A) The plasmonic reflectors are designed with a radius of curvature twice the cavity length (R = 2L cavity) and include a parabolic correction. Plasmons emitted into the cavity are spatially confined in a stable cavity mode, depicted in red. (B) When ~100 quantum dots are placed in the cavity and weakly photoexcited, they emit into plasmonic cavity modes. The experimental cavity spectrum, measured by detecting plasmons scattered into the far field at the outer edge of one of the reflectors, is shown in red. The calculated spectra of the stable plasmonic cavity modes are in gray (see sections S4 and S5). The slight offset is due to a slightly smaller experimental cavity length (9.965 μm). (C) When a cavity filled with quantum dots as in (D) is weakly photoexcited, modes appear as ripples in the cavity spectrum [collected as in (B)] only at longer wavelengths due to losses from the quantum dot film. Calculated modes (neglecting quantum dot absorption) are in gray. a.u., arbitrary units. (D) Top-view electron micrograph of the cavity for comparison with (A). The quantum dot stripe is printed to maximize spatial overlap with the cavity mode. (E) Under pulsed excitation (130 μJ/cm2), a small feature rises on top of the cavity spectrum at the position of a calculated plasmonic mode. Right inset: Real-space image (false color) of the emission from the quantum dot stripe. The two bright spots are due to scattering off the reflectors. (F) At higher excitation (250 μJ/cm2), the small peak in (E) narrows and increases in intensity. Right inset: Real-space image as in (E). The device exhibits decreased emission within the stripe and increased signal at the reflectors. The changes in the spectra and images in (E) and (F) are indicative of the onset of spasing. Cartoons in (B) and (D) to (F) depict the optical excitation and collection processes.