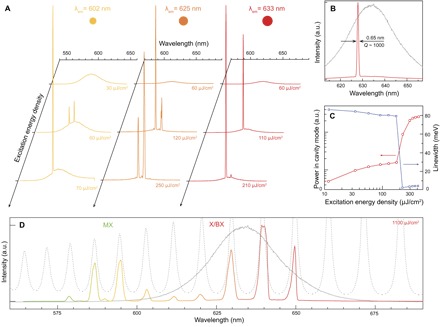
Fig. 3. Analysis of quantum dot spasers.

(A) Quantum dot samples with emission centered at 602, 625, and 633 nm were used to fabricate spasers. Cavity spectra for each are plotted for three excitation intensities, one below and two above threshold. (B) The 633 device from (A) exhibited a single spasing mode above threshold (red curve). Typical linewidths were 2 meV (0.65 nm, Q ~ 1000). The broad photoluminescence spectrum from quantum dots on flat Ag (outside the cavity) is shown for comparison (gray curve). (C) The input-output power plot of the 633 device (red points) reveals an inflection at ~180 μJ/cm2. Spasing thresholds as low as ~100 μJ/cm2 were observed. The spectral full-width at half-maximum (blue points) decreases dramatically at the same inflection point, consistent with the onset of spasing. (D) When the 633 device is excited at very high intensities (~1000 μJ/cm2), a progression of spasing modes is observed. These occur within the gain envelopes of the exciton/biexciton (X/BX) centered at ~640 nm and the multiexcitons (MX) centered at ~590 nm. The ~160-meV spacing between the envelopes is consistent with previous measurements (35). The broad quantum dot spectrum (solid gray curve) from (B) and the expected plasmonic modes for a film with n = 1.60 (dashed gray curve) are shown for comparison.
