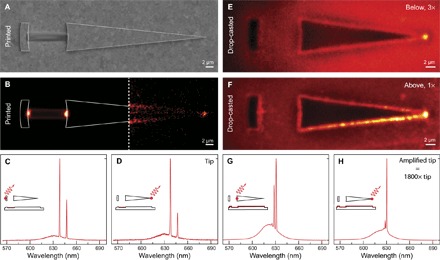
Fig. 4. Extraction, amplification, and focusing of plasmons generated by quantum dot spasers.

(A) Top-view electron micrograph of a spaser with a printed quantum dot stripe and an elongated reflector (11.5° taper) to guide and nanofocus the spaser signal. (B) Real-space image (false color) of the device in (A) above threshold. The contrast of the image to the right of the vertical dashed line is enhanced (104) to show the plasmons focused at the tip. (C and D) Spectra measured by collecting plasmons scattered at the outer reflector edge (C) and the tip (D) confirm that the spasing signal is guided and focused. (E and F) Real-space images (false color) of a cavity with an elongated reflector (14° taper) coated with a ~150-nm-thick drop-casted quantum dot film, excited below and above threshold, respectively. The intensity of (E), which is multiplied by 3, is fairly uniform across the device with some broadband focusing at the tip. In (F), plasmons generated by the cavity are amplified and focused at the tip. (G and H) Spectra measured by collecting plasmons scattered at the inner reflector edge (G) and the tip (H) confirm that a single spasing mode is selectively guided, amplified, and focused. The signal in (H) (with amplification) is 1800 times greater than that in (D) (without amplification).
