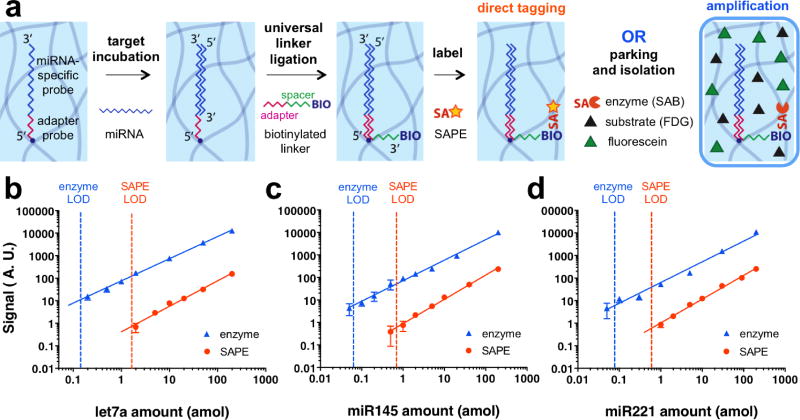
Figure 4. Application to highly sensitive miRNA detection.
(a) Schematic of miRNA detection using direct tagging or amplification strategies. (b-d) Calibration curves for quantification of three different miRNA species. Orange and blue dotted lines represent the limit of detection (LOD) of direct tagging (SAPE) and amplification (enzyme) schemes, respectively. Solid lines show best fits for the data (least-squares linear fit of log-transformed values). Amplification factors are 12 for let7a (b), 11 for miR145 (c), and 8 for miR221 (d). Our platform for particle isolation within droplets enables the use of the amplification strategy, resulting in one order of magnitude improved LOD compared to direct tagging.

