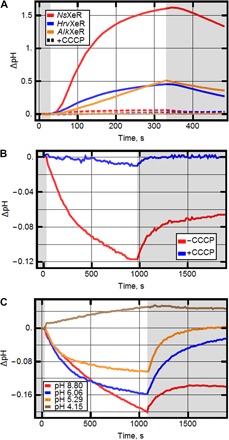
Fig. 1. Electrogenic properties of XeR.

(A) pH changes upon illumination in E. coli cell suspensions expressing different XeRs. Graphs show the pH changes with and without the addition of CCCP. (B) pH changes upon illumination in liposome suspension with reconstructed NsXeR (with and without CCCP). (C) pH changes upon illumination in liposome suspension measured under different pH values.
