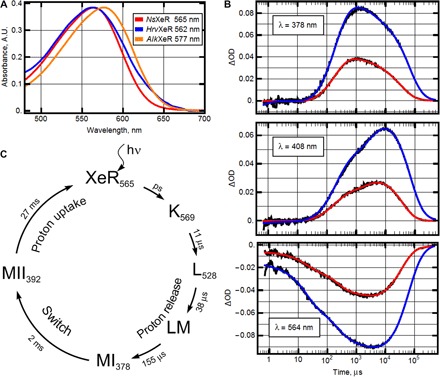
Fig. 2. Spectroscopic characterization of NsXeR.

(A) Absorption spectra of representatives of XeR family solubilized in the detergent DDM (n-dodecyl-β-d-maltoside). The corresponding positions of absorption maximum are indicated in the legend. A.U., arbitrary units. (B) Transient absorption changes of NsXeR (pH 7.5, T = 20°C) at three representative wavelengths: 378, 408, and 564 nm. Black lines represent experimental data, and red and blue lines represent the result of global fit using five exponents. The photocycles were measured for the two preparations: NsXeR in nanodiscs (red) and in liposomes (blue). Note that the differences in amplitudes between the samples are due to the approximately two times higher concentration of NsXeR in liposomes than in nanodiscs (see fig. S3). ΔOD, change in absorbance. (C) Proposed model of NsXeR photocycle in nanodiscs.
