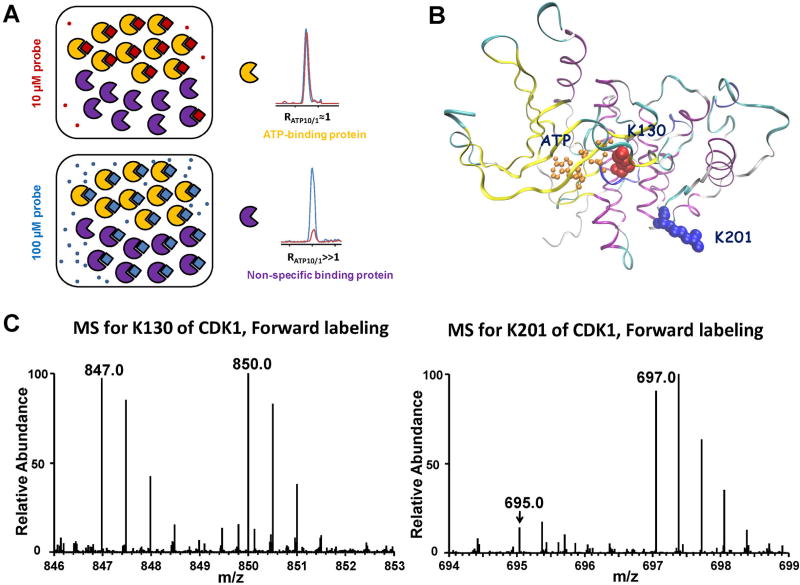
FIGURE 10.
A: A Cartoon representation showing expected labeling behavior of proteins with ATP-binding affinity (yellow) or without ATP-binding affinity (purple) treated with a low (10 µM) and high (100 µM) concentrations of the ATP-probe. At the low probe concentration, the ATP-binding protein labels to completion, but the non-specific binding protein is only partially labeled. At high probe concentration, the ATP-binding protein is still labeled to completion, whereas the non-specific binding protein shows much greater labeling. Modified from Weerapana et al. (2010). B: Crystal structure of CDK1 homologue, CDK2, bound with ATP displays the structural relationship between K130, K201, and ATP-binding sites on CDK1. C: Peptide DLK130#PQNLLIDDK with a low RATP10/1 ratio from cyclin-dependent kinase 1; Peptide K201#PLFHGDSEIDQLFR with a high RATP10/1 ratio from cyclin-dependent kinase 1. “#” Denotes the desthiobiotin-labeling site.

