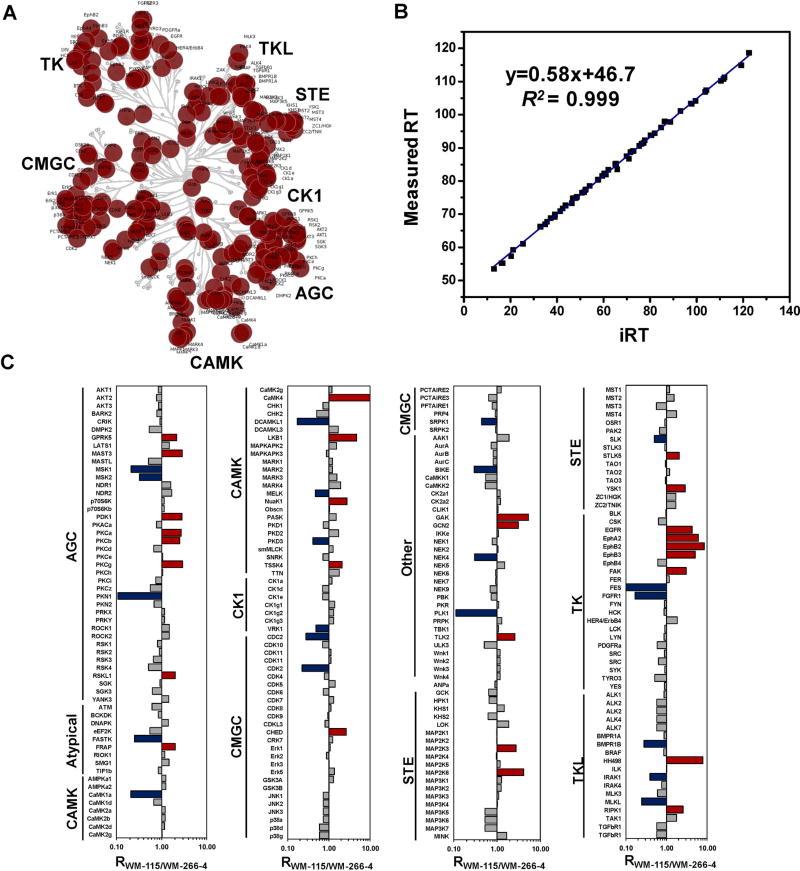
FIGURE 7.
MRM-based targeted proteomic approach for quantitative kinome profiling. A: Targeted protein kinases mapped in the dendrogram of the human kinome. B: iRT values predict measured RT in LC-MRM experiment (130 min linear gradient) with an excellent correlation coefficient (R2 = 0.999). C: Quantitative comparison of kinome expression in WM-115 and WM-266-4 cells. Blue and red bars denote kinase upregulated in WM-266-4 and WM-115 cells, respectively. Modified from Xiao et al. (2014a).

