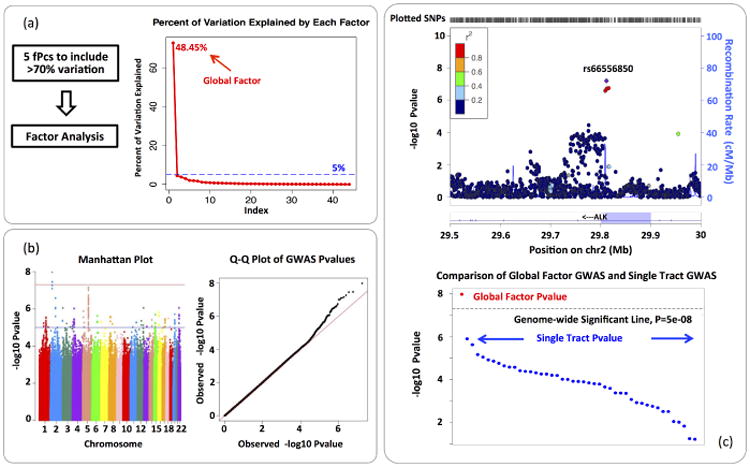
Fig. 3.

Real Data Analysis Result: (a) Functional PCA and Factor Analysis. (b) Visualization of GWAS result of the global factor. (c) A comparison between global factor analysis and single tract analysis on marker rs66556850, the −log10p value in the association test is plotted. The majority of pvalues in single tract analysis are around 10−2 ∼ 10−6.
