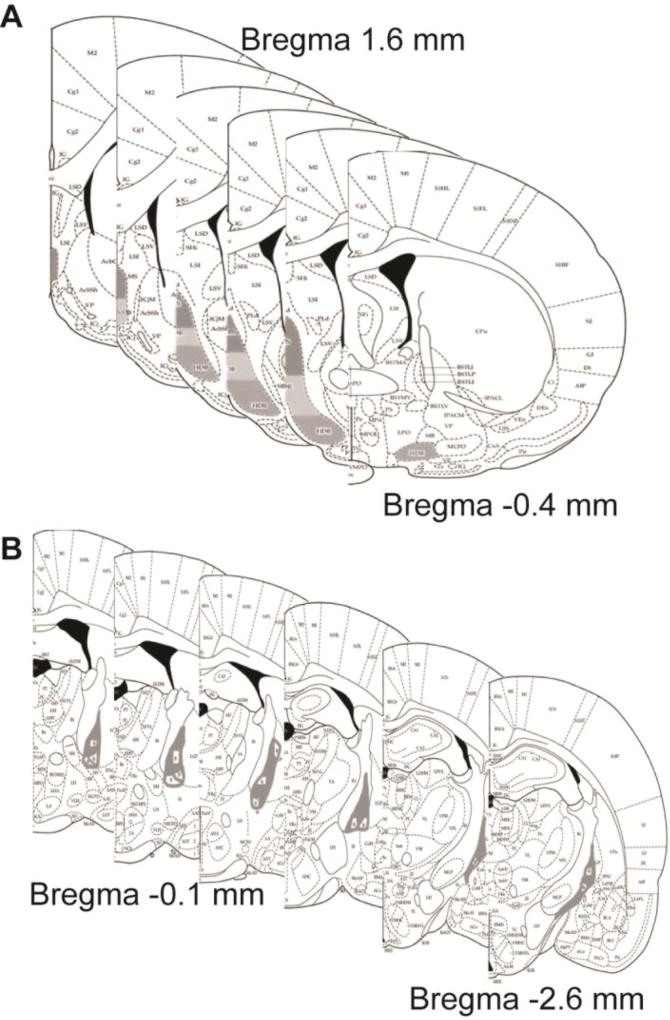
Fig. 4. Cell Counting Regions of Interest.
Schematic demonstrating representative cell counting contours for the medial septum/diagonal band (A), which began at 1.6 mm relative to Bregma and extended through −0.4 mm relative to Bregma. The light grey contours outline the medial septum, the dark grey outline denote the vertical limb of the diagonal band and the grey countours outline the horizontal limb of the diagonal band. Panel (B) illustrates the contours made for cell counts in the Nucleus basalis of Mynert, which extended from −0.96 mm to −2.64 mm relative to Bregna. All diagrams are taken from (Paxinos and Watson, 2013).

