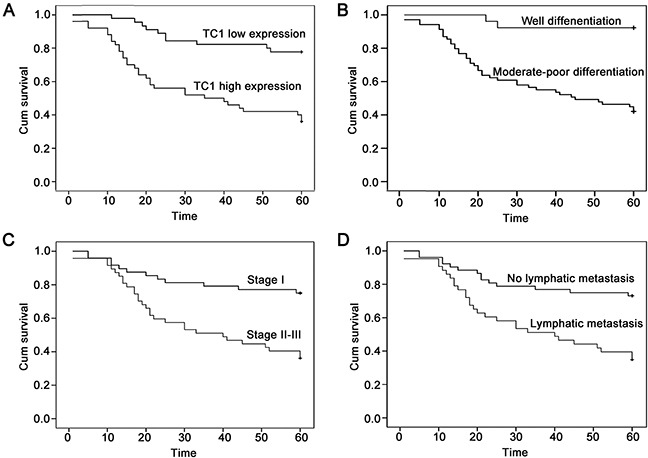
Figure 2. The Kaplan-Meier curves of lung cancer patients.

(A) The Kaplan-Meier curve of lung cancer patients with high or low TC1 expression. (B) The Kaplan-Meier curve of lung cancer patients with well or moderate-poor differentiation. (C) The Kaplan-Meier curve of lung cancer patients with TNM stage I or stage II-III. (D) The Kaplan-Meier curve of lung cancer patients with or without lymphatic metastasis.
