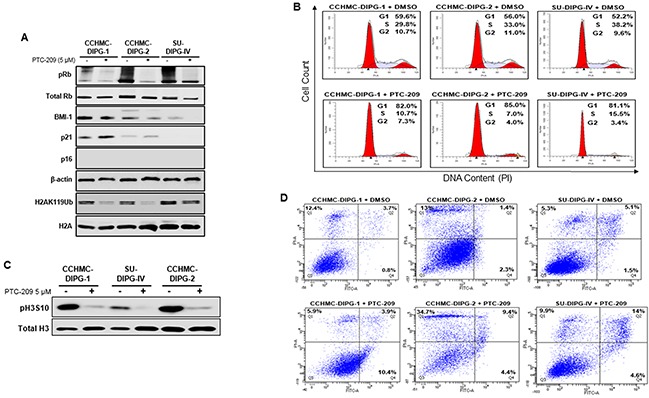
Figure 3. BMI-1 downregulation affects RB pathway, induces G1/S cell-cycle arrest and apoptosis in DIPG cells.

(A) Immunoblot analysis of pRB, total Rb, BMI-1, p21, p16ink4A and H2AK119Ub extracted from DIPG cell lines treated with DMSO or PTC-209. β-actin and total H2A served as loading controls. (B) Cell cycle analysis of PTC-209 treated DIPG cells. DMSO treatment represents the control. Analysis was performed by gating on live cells only. Percentage of cells in G1, S and G2/M is indicated. (C) Immunoblot analysis of pH3S10, a marker of mitosis. Total H3 served as loading control. (D) Flow-cytometry analyses of PTC-209 or DMSO treated DIPG cells stained with annexin-V and propidium iodide (PI). The percentage of apoptosis (lower far right quadrant) and overall cell death (upper far right quadrant) is indicated. In all experiments, cells were either treated with DMSO or 5 μM PTC-209 for 3 days.
