
Figure 4. BMI-1 downregulation by PTC-209 leads to an increase in H3K27me3 levels.
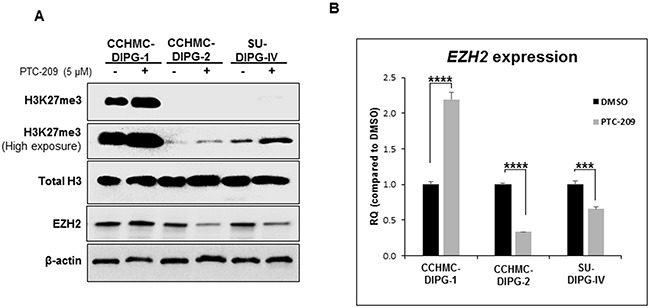
(A) Immunoblot analysis of H3K27me3 and EZH2 from DIPG cell lines treated for 3 days with 5 μM PTC-209. β-actin and total H3 served as loading controls. (B) EZH2 expression in DIPG cell lines treated for 3 days with 5 μM PTC-209 by qPCR. Error bars represent the standard deviation obtained from triplicates for each condition. Each experiment was performed at least twice. *, P < 0.05; **, P < 0.01; ***, P < 0.001; ****, P < 0.0001.