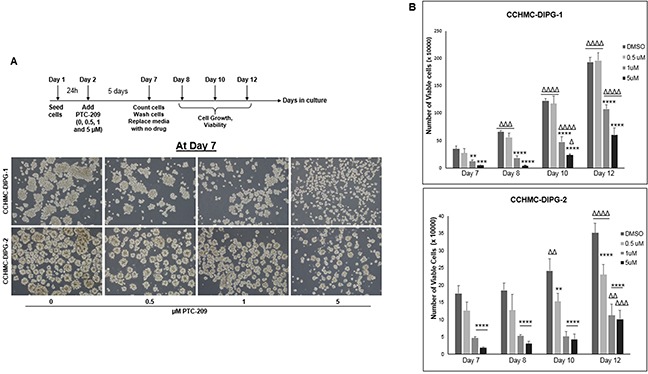
Figure 6. BMI-1 downregulation by PTC-209 irreversibly impairs the self-renewal capacity of DIPG cells.

(A) Schematic of the drug removal experiment and representative images of cells at Day 7 (5 days of continuous treatment). (B) Corresponding plots showing the quantifications of viable cell numbers after removal of PTC-209, at days 8, 10, and 12. Error bars represent the standard deviation from triplicates. *, P < 0.05; **, P < 0.01; ***, P < 0.001; ****, P < 0.0001. Δ, P < 0.05; ΔΔ, P < 0.01; ΔΔΔ, P < 0.001; ΔΔΔΔ, P < 0.0001.* denotes comparison between doses on the same day, Δ denotes comparison between days with the same dose.
