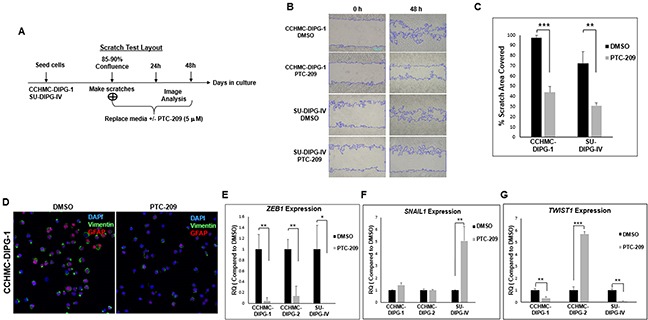
Figure 8. PTC-209 treatment inhibits the invasive properties of DIPG and downregulates the EMT factors ZEB1 and Vimentin.

(A) Experimental design of the scratch assay. (B) Representative images of the scratch assay at 0 and 48 hrs-time points post-treatment. (C) Quantifications of the scratch assay showing the percentage area covered in 48 hrs with after DMSO or PTC-209 treatment. (D) Representative immunofluorescence images GFAP (red) and Vimentin (green) expression in CCHMC-DIPG-1 and SU-DIPG-IV cells after treatment with DMSO 5 μM PTC-209 for 3 days, DAPI (blue). (E–G) ZEB1, SNAIL1 and TWIST1 expression in cells treated with DMSO or 5 μM PTC-209 for 3 days by qPCR. Error bars represent the standard deviation from three independent experiments performed in triplicates. *, P < 0.05; **, P < 0.01; ***, P < 0.001; ****, P < 0.0001.
