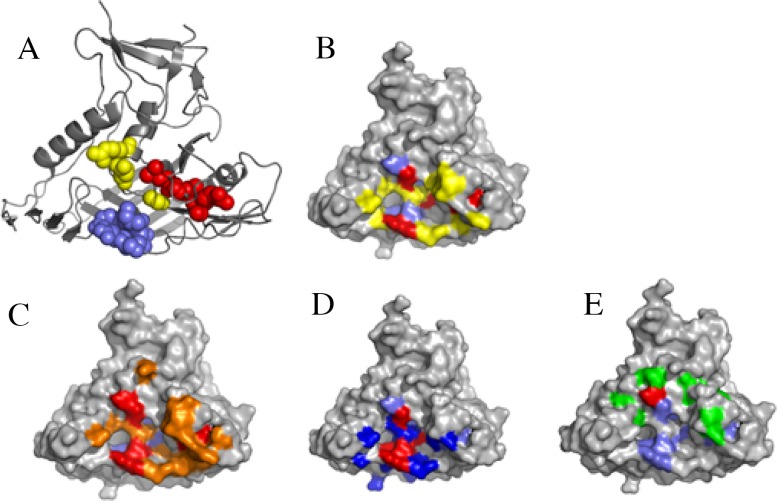
Figure 9. Analysis of Y498 epitope by surface representation.
(A) Presentation of the Y498 epitope on gp120 core (PDB ID: 3DNN). The residues in the CD4-binding loop (G367, D368, E370, I371, V372) are labeled in slate, the residues in the β23 strand (L453, L454, R456) are labeled in red, and the residues in the β24∼α25 connection region (G471, D474, R476) are labeled in yellow. (B) The overlapping residues of Y498 epitope and CD4bs. The Y498-binding residues are marked in slate, the CD4-binding residues are in yellow, and their overlapping residues (G367, D368, R456, G471, D474) are in red. (C) Comparison of the Y498 and b12 epitopes. The Y498-binding residues are marked in slate, the b12-binding residues are in orange, and their overlapping residues (G367, D368, E370, I371, G471, D474) are in red. (D) Comparison of the Y498 and VRC01 epitopes. The Y498-binding residues are marked in slate, the VRC01-binding residues are in blue, and their overlapping residues (G367, D368, R456, G474) are in red. (E) Comparison of the Y498 and A16 epitopes. The Y498-binding residues are marked in slate, the A16-binding residues are in green, and their overlapping residue (R476) is shown in red.

