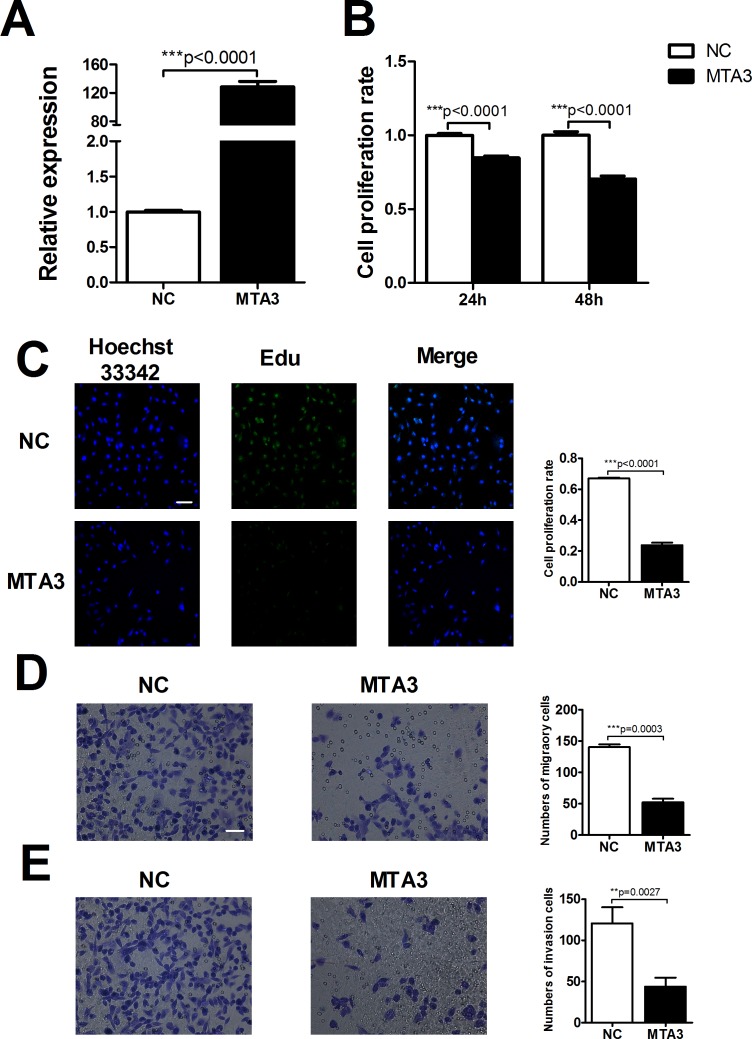
Figure 7. MTA3 is involved in ccRCC proliferation and metastasis.
(A) Transfection efficiency of MTA3 overexpression was assessed by qRT-PCR. (B) MTT assay to confirm the ability of MTA3 on ccRCC cell viability. (C) After treatment with MTA3 plasmid, the proliferation rate of 786-O cells was determined by EdU kit. (D and E) Representative micrographs (left) were showed. Relative quantification (right) of cell migration (top) and invasion (bottom) were measured after infected with negative control (NC) or MTA3 in 786-O cells. Scale bar indicates 100 μm. Data are expressed as mean ± SEM. **p<0.01 or *p<0.05 vs. NC.

