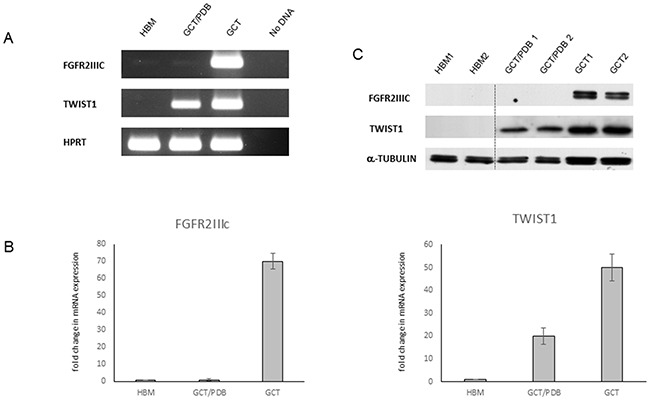
Figure 2. Differential expression of FGFR2IIIc and TWIST1 in GCT and GCT/PDB.

(A) RT-PCR and (B) qRT-PCR in healthy bone marrow (HBM), GCT/PDB and GCT showing FGFR2IIIc and TWIST1 expression profile (fold of expression). The results are expressed as the fold change compared to healthy bone marrow samples, using the ddCT method. (C) FGFR2IIIc and TWIST1 protein levels are showed.
