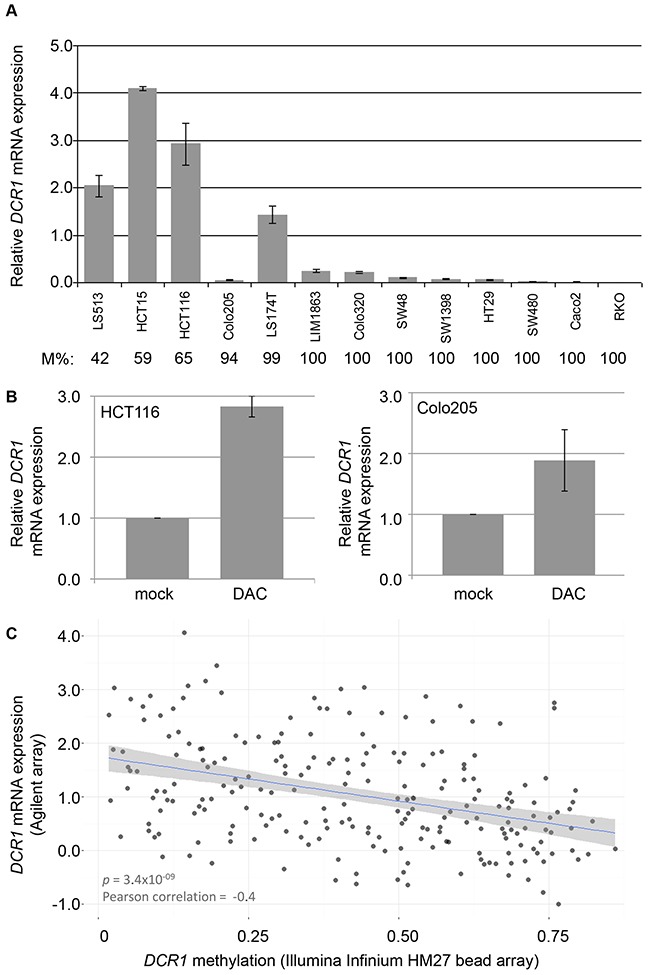
Figure 4.

DCR1 methylation and mRNA expression levels (A) DCR1 mRNA expression analysis in CRC cell lines by RT-PCR. DCR1 DNA methylation percentage as measured by qMSP (M%) is indicated below each cell line. Quantifications represent mean expression values from three independent experiments. (B) DCR1 mRNA expression analysis by RT-PCR of HCT116 (left panel) and Colo205 (right panel) with and without DAC treatment (p=0.005 and p=0.08, respectively). (C) Scatter plot including a linear regression line and 95% confidence interval, showing the correlation of DCR1 methylation levels and DCR1 mRNA expression in 223 CRC tissues from TCGA.
