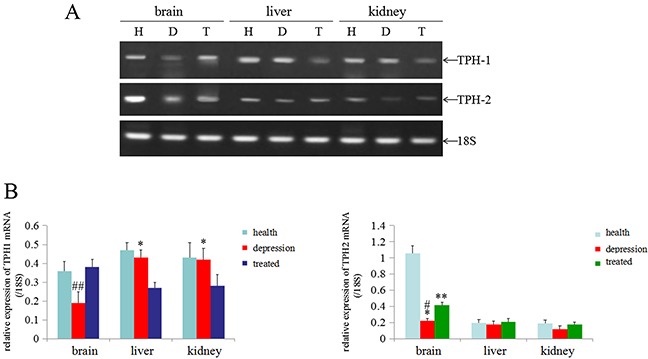
Figure 4. Expression of the TPH1/2 mRNAs in rat tissues.

(A) RT-PCR analyses were used to measure the expression of the TPH1/2 mRNAs in the brain, liver and kidney of healthy, depressive modeland treated rats; 18S was used as an internal control. (B) The relative quantity of TPH1/2 mRNAs from RT-PCR (from the images shown in A), ##P<0.01 vs healthy and treated groups, *P<0.05 vs treated group, **P<0.01 vs healthy group, #P<0.01 vs healthy group. H: Healthy rats; D: depressive model rats; T: depressive model rats treated with paroxetine. The images are representative of six independent experiments.
