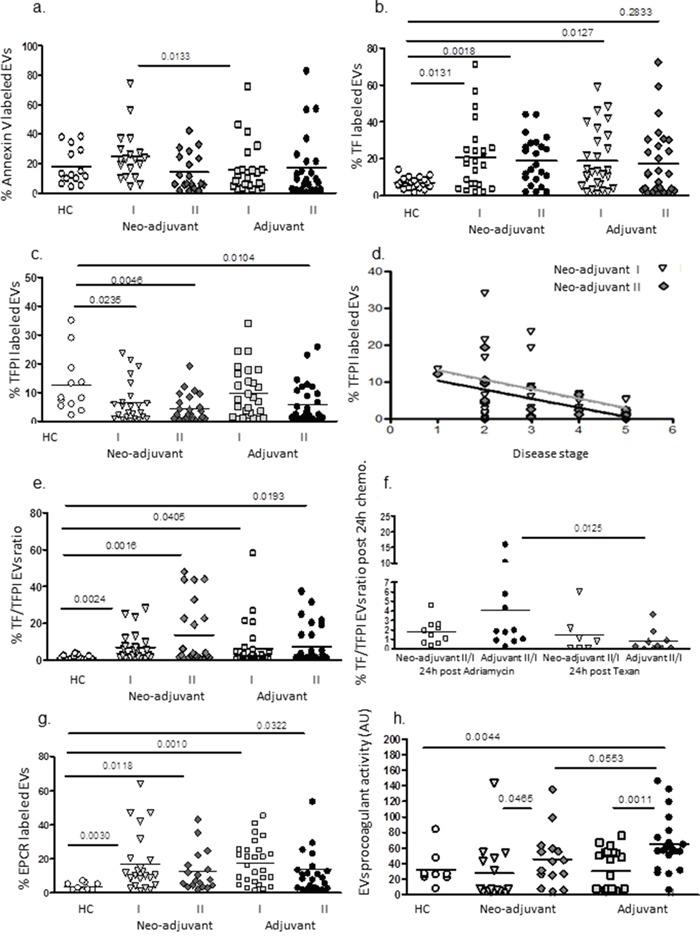
Figure 4. EVs thrombogenicity.

Levels of negatively charged phospholipids (labelled by Annexin V-FITC) and antigen levels of coagulation markers TF and TFPI were measured on EVs obtained from healthy controls and on EVs obtained from patients before chemotherapy (time point I) and at the last chemotherapy treatment (time point II), using specific fluorescent antibodies. The percentage of labelled EVs was calculated from the total number of EVs using FACS analysis and the ratio between TF and its inhibitor TFPI were calculated (a-d). Correlation between EVs –TFPI expression and disease severity in neo-adjuvant patients at the end of chemotherapy was performed (e). In addition, the change in TF/TFPI ratio after 24hours of first treatment with Adriamycin and cyclophosphamide or paclitaxel were measured as well (f). Levels of EPCR on EVs (g). Pro-coagulant activity of EVs was measured by the FXa chromogenic assay. Results are expressed as TF arbitrary units (h).
