
Figure 2.
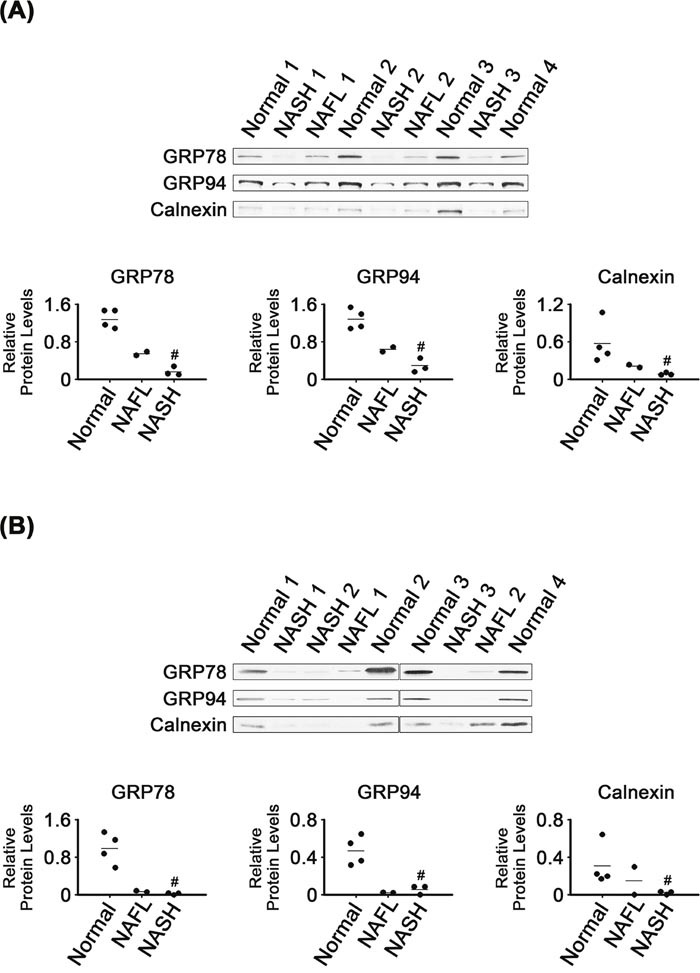
Expression of ER chaperones in NASH, NAFL and normal liver tissues (A) and in their microsomes (B). β-Actin was used as an internal control for the whole tissue samples, as described for Figure 1. Horizontal lines represent means of densitometry signals from the western blot analyses for the sample groups. #, significant differences in signals between NASH and normal liver tissues or microsomes (P < 0.05). Data for NAFL tissues were not used for statistical comparisons because of limited sample number (n = 2).