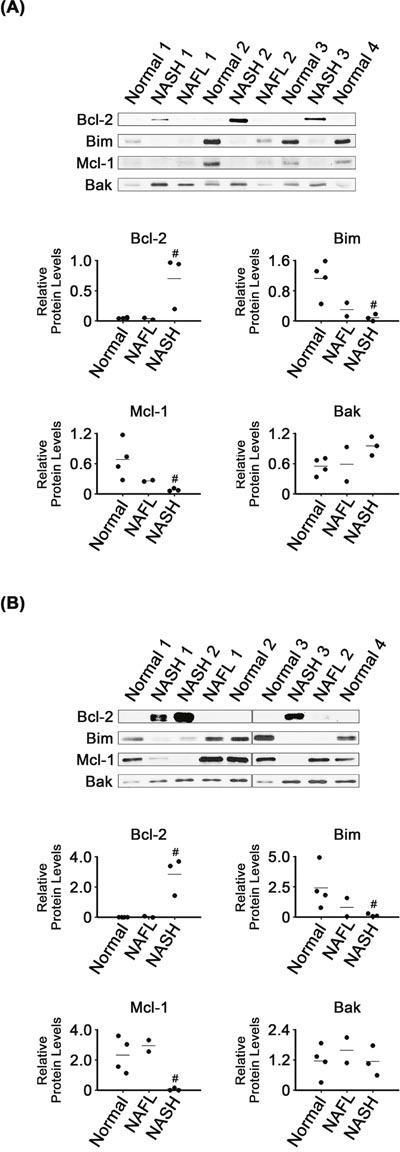
Figure 5.

Expression of Bcl-2 family proteins in NASH, NAFL and normal liver tissues (A) and in their mitochondria (B). β-Actin and VDAC were used as internal controls for the whole tissue and mitochondria samples, as described for Figures 1 and 4, respectively. Horizontal lines represent means of densitometry signals from the western blot analyses. #, significant differences in signals between NASH and normal liver tissues (P < 0.05). Data for NAFL tissues were not used for statistical comparisons because of limited sample number (n = 2).
