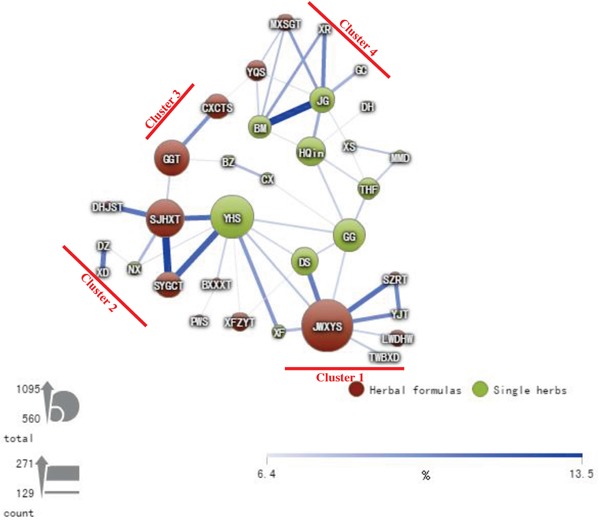
Figure 7. CHM network for female patients with T2D.

The connection lines between CHMs represent user numbers for CHM combinations. The connection between CHMs is more important when the connection line is thicker and darker. The size of the circle represents the frequency of prescriptions for each CHM.
